
Writing Task 1 (2) - Line Graph - Thanks!
Please help me check my essay and give me some detailed advice. I truly appreciate that. Thanks!
Question:
Answer:
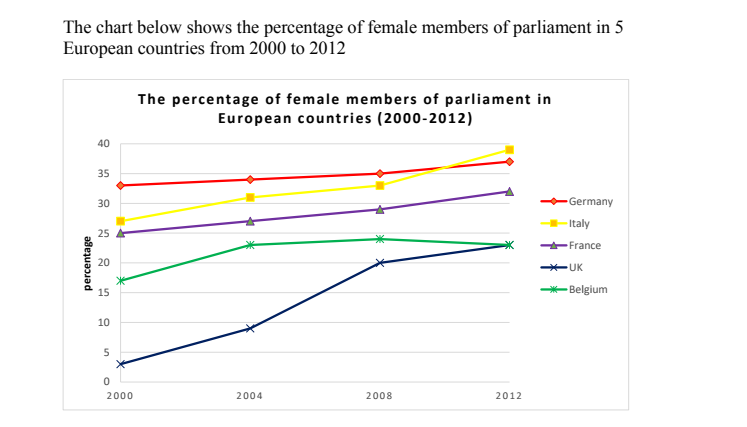
The line graph compares the proportion of women in parliament in 5 different European countries over a period of 12 years.
Overall, it is clear that the percentage of female members of parliament in each country saw a significant increase almost all the time surveyed. However, the figures for the UK experienced the most dramatic change, rising by up to 20%.
In 2000, there was only 3% of members of parliament in the UK being female, in comparison with about 17%, 25%, 27% and 33% of Belgium, France, Italy and Germany respectively. From 2000 to 2008, the figures for the UK showed a considerable growth of 17%, whereas the figures for 4 other countries just went up gradually.
In the second half of the period surveyed, the data of the UK, France, Italy and Germany rose slightly to 23%, 32%, 39% and 37% respectively. In contrast, Belgium saw a smooth decline of around 1% in the proportion of women in parliament before dropping to the lowest point of the whole line graph, 23%, in 2012.
(175 words).
Top answer
The line graph compares the proportion of women in parliament in 5 (Write out numbers less than 10) different European countries over a period of 12 years. Overall, it is clear that the percentage of female members of parliament in each country saw a significant increase almost all the time surveyed. ) 20%.
- The line graph compares the proportion of women in parliament in 5 (Write out numbers less than 10) different European countries over a period of 12 years.
- Overall, it is clear that the percentage of female members of parliament in each country saw a significant increase almost all the time surveyed.
- ) 20%.
- ) in comparison with about 17%, 25%, 27% and 33% of Belgium, France, Italy and Germany respectively.
- From 2000 to 2008, the figures for the UK showed a considerable growth of 17%, whereas the figures for (missing word) 4 other countries just went up gradually.
Get the Weekly English Kit 📬
New words, one handy idiom, and a 2-minute quiz — delivered to your inbox to keep your streak alive.
The line graph compares the proportion of women in parliament in 5 (Write out numbers less than 10) different European countries over a period of 12 years.
Overall, it is clear that the percentage of female members of parliament in each country saw a significant increase almost all the time
 Related Questions