
Writing task 1 (2)
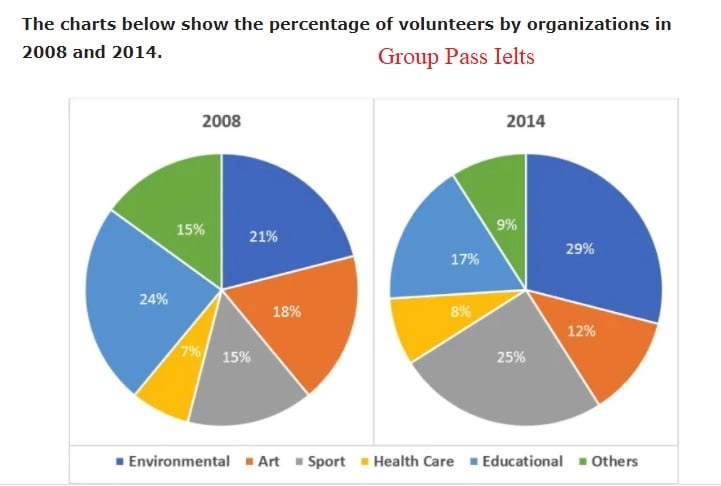
The two pie charts, one labelled 2008 and the other 2014, compare the percentage of volunteers by organizations. Five organizations were given, environment, art, sport, health care, education. There is a sixth category labelled ‘others’.
Overall, the lowest proportion of volunteers went to health care in both years. In 2008, education had the highest percentage of volunteers, but it was overtaken by environment in 2014.
In detail, in 2008, about a third (31%) of volunteers worked in either education or health care, which was double the percentage of volunteers in sport (15%). In 2014, due to its 10% rise, the ratio was 1:1, with 25% for sport and 25% for education and health care. There was a 6% decrease in the percentage of volunteers in either Art or ‘others’. The value for environment in 2008 was in second place, with 21%, but in six years later the majority of volunteers worked in this organization, with 29%.
Get the Weekly English Kit 📬
New words, one handy idiom, and a 2-minute quiz — delivered to your inbox to keep your streak alive.
 Related Questions