
Writing task 1
Please check this report for me
The pie charts give information about the amount of electricity produced from five different sources in Australia and France in two years, 1980 and 2000.
Overall, the total electricity production in both countries increased from 1980 to 2000. After 20 years, coal was the vital source to produce energy in Australia, while, in France, the amount of electricity was almost replaced by nuclea power.
In 1980, 50 units of electricity was produced in 1980 from coal of the total 100 units of electricity. Natural gas and hydropower were generated of equal amount of electricity, with 20 units, being double the figure for oil. Until 2000, coal was also the most of source to produce energy in this country, with 130 units of electricity, while other sources were responsible for producing a neglible amount of electricity, except hydropower less than 25%.
The total of electricity doubled in two decases, at 180 units in France. In which, the amount of electricity was produced mainly from three sources of coal, oil and natural gas. In 2000, they were replaced by nuclear power with 126 units of the total 180 units produced. Nutural gas and hydropower have decreased significantly, whereas coal and oil were still the second sources to produce electricity in this country.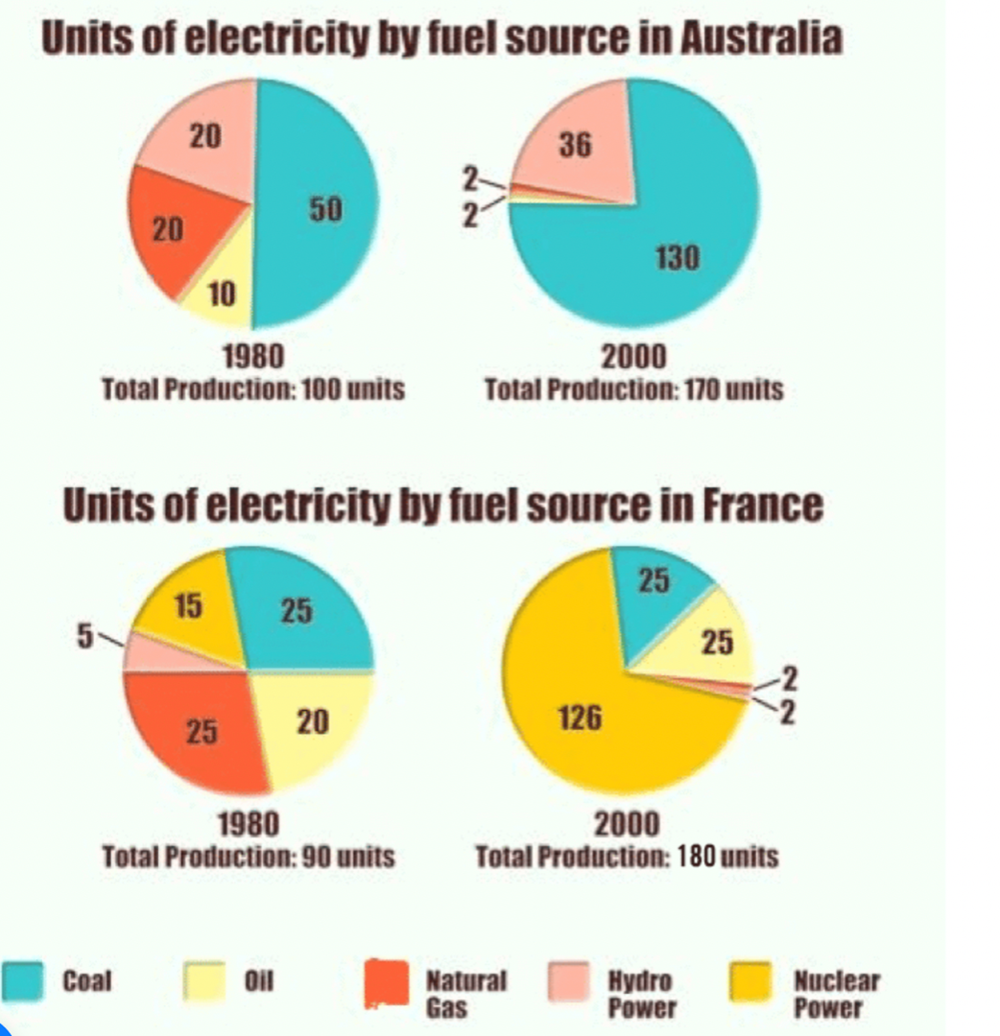
Top answer
The pie charts give information about the amount of electricity produced from five different sources in Australia and France in two years, 1980 and 2000. Overall, the total electricity production in both countries increase d, and from 1980 to 2000. After 20 years, coal was the vital main source to produce energy in Australia in both years , while, in France, the distribution was fairly even in the initial year, but amount of electricity was almost replaced by nucle a r power was by far the most dominant in the latter .
- The pie charts give information about the amount of electricity produced from five different sources in Australia and France in two years, 1980 and 2000.
- Overall, the total electricity production in both countries increase d, and from 1980 to 2000.
- After 20 years, coal was the vital main source to produce energy in Australia in both years , while, in France, the distribution was fairly even in the initial year, but amount of electricity was almost replaced by nucle a r power was by far the most dominant in the latter .
- ----------------------------------------- You need to tidy up the subsequent paragraphs.
- 1- Write one paragraph for Australia and one for France, or one for 1980 and one for 2000.
Get the Weekly English Kit 📬
New words, one handy idiom, and a 2-minute quiz — delivered to your inbox to keep your streak alive.
The pie charts give information about the amount of electricity produced from five different sources in Australia and France in two years, 1980 and 2000.
Overall, the total electricity production in both countries increased, and from 1980 to 2000. After 20 years, coal was the vit
I rewrote my essay with 2 body paragraphs one for Australia, one for France.
The pie charts give information about the amount of electricity produced from five different sources in Australia and France in 1980 and 2000.
Overall, the total electricity production in both countries increased, and coal was the main source to produce energy in Australia in both years, while, in France,
 Related Questions