
Writing Task 1
Please help me correct my essay. Thank you in advance.
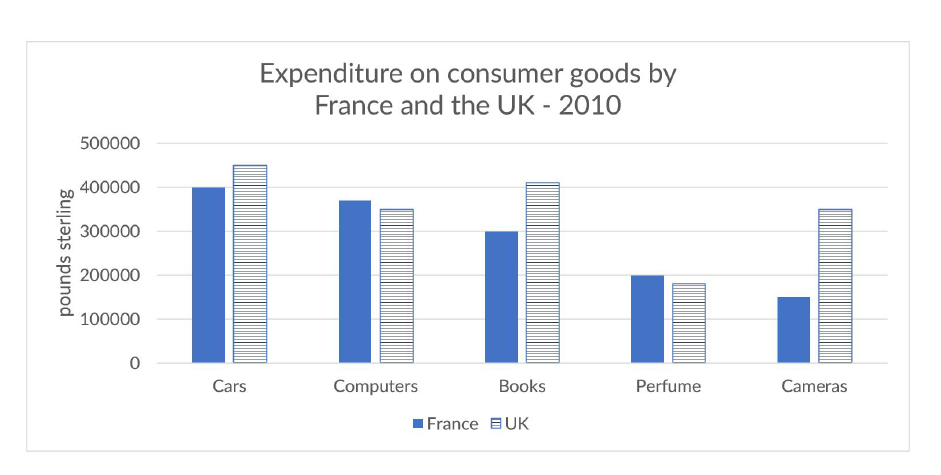
Topic: The chart below shows the expenditure of two countries on consumer goods in 2010.
Script:
The bar chart gives information about the spending of French and British people on consumer goods in 2010.
Overall, the consumption in the UK exceeds that in France, except for the two categories, namely Computers and Perfume, where the patterns are slightly opposite.
As can be seen from the chart, cars was the most spent item by both countries, with around 450,000 pounds expended in the UK, compared to 400,000 pounds in France. The expenditure on Books and Cameras also followed the same pattern, in which, the French spent around 300,000 pounds, less than 10,000 pounds compared to the British. In addition, Cameras had the biggest gap between two nations, where the spending in France was less than half of that in the UK (15,000 pounds compared to 35,000 pounds).
On the other hand, the disparity in spending between two countries was quite similar on Computers and Perfume, with French slightly spent more, at around 39,000 and 20,000 respectively, which was around 1,000 pounds more than that of each item in the UK.
Top answer
Please read my advice for Task 1 essays: IELTS TASK 1: Hints, Tips And Advice Vocabulary Words For Task 1: Reference Post
- Please read my advice for Task 1 essays: IELTS TASK 1: Hints, Tips And Advice Vocabulary Words For Task 1: Reference Post
Get the Weekly English Kit 📬
New words, one handy idiom, and a 2-minute quiz — delivered to your inbox to keep your streak alive.
The bar chart gives information about (That is very vague. What exactly is plotted?) the spending of French and British people on consumer goods (That implies a sum, that is, total spending on all consumer goods. That is NOT what is on the chart. You need to be accurate and precise. Read my advice.) in 2010.
Overall,
Sample essay (~185 words)
Paragraph #1 Describe the figure, but not the information content.
Paragraph #2 "Overall" This paragraph has 2 or 3 of the most significant observations. The first one is from summing all five categories for each country.
Paragraph #3. Write about some interesting details. Do not write about every data point on the chart. You are only supposed to
 Related Questions