
Writing task 1
The bar chart outlines the number of men and women who participated in Olympic Games in 1924, 1952, 1984 and 2012, while the line graph presents data about the aggregate of participants at a time span of 88 years.
According to the bars, the number of male and female entrants who played in Olympics rose up and similarly the total number of participants, shown in the line graph, went up as well during 1924 to 2012.
The lowest number of men and women entering the game was in 1924 at a mere 3000 and nearly 100, respectively. On the contrary, it is noticeable from both graphs that the 2012 Olympics had the highest number of participants with both genders up to approximately 10500 individuals with almost 6000 men and 5500 women.
As it can be observed from the line graph, we have an upward trend for the whole number of participants during 88 years and Another striking feature in the bar chart is that although the difference between the males and the females in Olympics were at about 2900 in 1924, it reduced to a little under 1500 in 2012.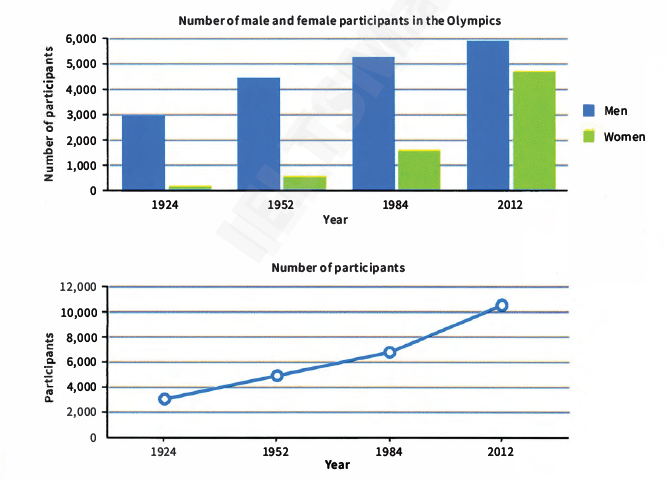
Top answer
The bar chart outlines (poor word choice. No native speaker would choose "outline") the number of men and women who participated in Olympic Games in 1924, 1952, 1984 and 2012, while the line graph is redundant, giving the sum of the male and female participants at those same years. presents data about the aggregate of participants at a time span of 88 years.
- The bar chart outlines (poor word choice.
- No native speaker would choose "outline") the number of men and women who participated in Olympic Games in 1924, 1952, 1984 and 2012, while the line graph is redundant, giving the sum of the male and female participants at those same years.
- presents data about the aggregate of participants at a time span of 88 years.
- (Where did you find this terrible task?
- The data in the line graph has exactly the same information as the bar chart.
Get the Weekly English Kit 📬
New words, one handy idiom, and a 2-minute quiz — delivered to your inbox to keep your streak alive.
The bar chart outlines (poor word choice. No native speaker would choose "outline") the number of men and women who participated in Olympic Games in 1924, 1952, 1984 and 2012, while the line graph is redundant, giving the sum of the male and female participants at those same years. presents d
 Related Questions