
Writing task 1
The bar chart provides data about the percentage of adults with the age of 25 to 34 who had the affordability to buy and own a house or rent it between 2004 and 2015.
Overall, it is clear that the number of home owners in nine out of eleven consecutive years declined each year. On the other hand, the number of renters went up to the same extent as opposed to owners.
One striking feature is that although the percentage of people who possessed a house decreased over eleven years, they are constantly more than renters in most years save for 2013 and 2014. The most difference between them is in 2004 and the least one is in 2011 to 2012.
A closer look indicates that in spite of the fact that the number of house owners had an upward trend and the opposite trend happening to the number of renters, in 2007 there is a minuscule rise for owners and in 2006 and 2012 there is a small drop for renters.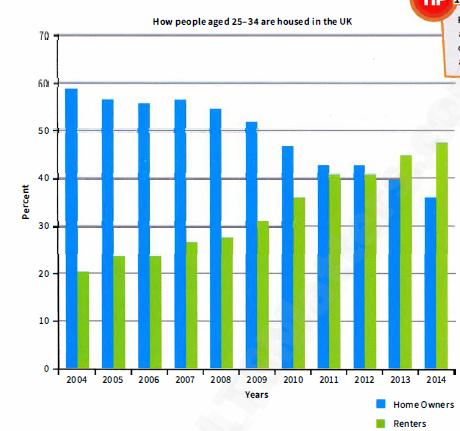
Top answer
The bar chart provides data about the percentage of adults with the age d of 25 to 34 who had the affordability could afford to buy and their own [ 1] home, a house or and the percentage of those who were rent ing, it between 2004 and 2015. Overall, it is clear that the number percentage of home owners in nine out of those eleven consecutive years declined each year. On the other hand, the number percentage of renters went up for every year bar two.
- The bar chart provides data about the percentage of adults with the age d of 25 to 34 who had the affordability could afford to buy and their own [ 1] home, a house or and the percentage of those who were rent ing, it between 2004 and 2015.
- Overall, it is clear that the number percentage of home owners in nine out of those eleven consecutive years declined each year.
- On the other hand, the number percentage of renters went up for every year bar two.
- to the same extent as opposed to owners .
- -------------------------------------- [ 1]: Note that a house is a type of building, whereas home is where someone lives.
Get the Weekly English Kit 📬
New words, one handy idiom, and a 2-minute quiz — delivered to your inbox to keep your streak alive.
The bar chart provides data about the percentage of adults with the aged of 25 to 34 who had the affordability could afford to buy and their own [ 1] home, a house or
 Related Questions