
Writing task 1.
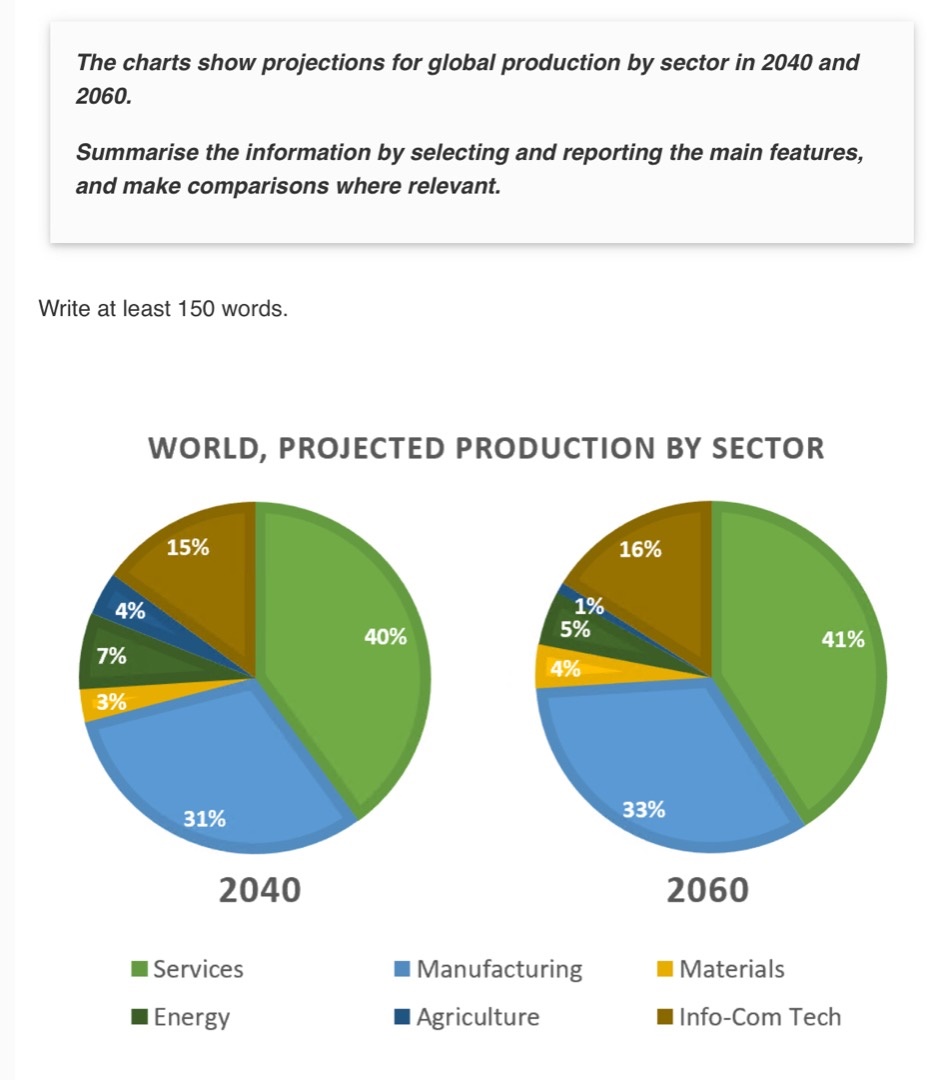
The two pie charts, one labelled 2040 and the other 2060, divide the projections for global production into six sectors, services, energy, manufacturing, agriculture, materials and infor-com tech.
Overall, there will be a drop in two sectors, energy and agriculture, in contrast to a slight rise in the four remaining sectors. The greastest difference between the two years will be agriculture. The largest percentages in both years will be service and manufacturing.
In detail, in 2040 energy will be double agriculture, but it will be five times as much as the other in 2060 (5% versus 1%). The smallest percentage in 2040 will go to materials, with 3%, whereas it will go to agriculture, which will make up only 1% in 2060. In 2040, only two sectors, materials and energy will account for 10%; however, it will produce 10% of its production from three sectors: energy (5%), materials (4%), agriculture (1%) in 2060. Both two years will show an equality between energy (7% for 2040 and 5% for 2060) and the total of two sectors: materials and agriculture.
Top answer
The two pie charts, one labelled 2040 and the other 2060, divide the projections for total global production into six sectors, services, energy, manufacturing, agriculture, materials and infor -com tech. Overall, there will be a drop in the proportions for two sectors, energy and agriculture, in contrast to a slight rise in the four remaining sectors. The greastest difference between the two years will be in agriculture.
- The two pie charts, one labelled 2040 and the other 2060, divide the projections for total global production into six sectors, services, energy, manufacturing, agriculture, materials and infor -com tech.
- Overall, there will be a drop in the proportions for two sectors, energy and agriculture, in contrast to a slight rise in the four remaining sectors.
- The greastest difference between the two years will be in agriculture.
- The largest percentages in both years will be service and manufacturing.
- In detail, in 2040 energy will be double agriculture, but it will be five times as much as the other in 2060 (5% versus 1%).
Get the Weekly English Kit 📬
New words, one handy idiom, and a 2-minute quiz — delivered to your inbox to keep your streak alive.
The two pie charts, one labelled 2040 and the other 2060, divide the projections for total global production into six sectors, services, energy, manufacturing, agriculture, materials and infor-com tech.
Overall, there will be a drop in the proportions for t
 Related Questions