
Writing task 1
Help me to check the grammar of my homework ( task 12 Pie chart in the picture). Thank you so much!
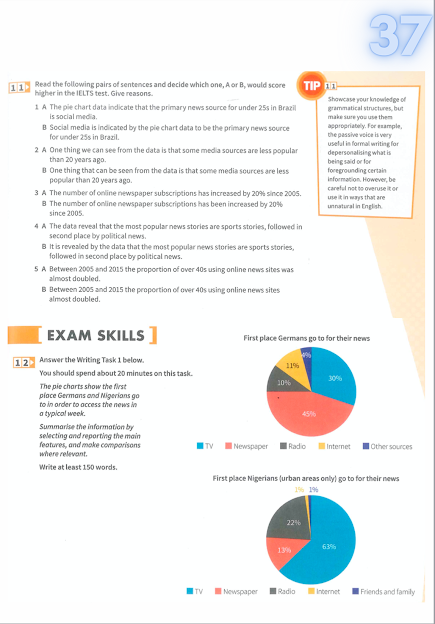
The pie charts display the proportion of the first source that an average person in Germany and Nigeria used to look for information in a typical week.
A notable feature of the data is that under a half of Germans surveyed said that the first source they went to for the news was the newspaper. This was followed by Television with 30 percent of surveyed Germans. Two options that are less popular than the aforementioned ones are Radio and Internet, with 10% and 11% respectively.
On the other hand, the most common place that Nigerians come for their news is Television, with 63%. Twenty-two percent of surveyed people answered that they opted for the radio as the first place they went for the news. It is also revealed that over a tenth of Nigerians use newspapers to search for information and only one percent said that they get the information through the Internet and their relatives.
Overall, there were noticeable differences in the habit of using means of communication to access the source of information between Nigerians and Germans.
Top answer
Please post essays, paragraphs, dialogues and other writing in the essay forum so a moderator does not have to move your post. htm
- Please post essays, paragraphs, dialogues and other writing in the essay forum so a moderator does not have to move your post.
- htm
Get the Weekly English Kit 📬
New words, one handy idiom, and a 2-minute quiz — delivered to your inbox to keep your streak alive.
Please post essays, paragraphs, dialogues and other writing in the essay forum so a moderator does not have to move your post.
https://www.englishforums.com/English/EssayReportCompositionWriting/Forum9.htm
The (How many?) pie charts display the proportion of the first source (Proportion of a source is not good English.) that an average person in Germany and Nigeria used to look for information in a typical week.
A notable feature of the data is that (Do not waste words with unnecessary clauses.)
 Related Questions