
Writing task 1
Hi, please help me with writing task 1.
The given line graph compares the consumption of six different energies in the USA in both history and future from 1980 to 2030.
In general, petrol and oil have been consumed to be the most common energy that was used during the observed period. Additionally, the consumption of hydropower has had a slightly decrease at the end of the period while the rest of energies have used with different increases in the amount.
Far away from that five energies, the amount of petrol and oil is 35 quadrillion units in 1980, it fluctuated volatile until 1995 then have rose steadily during the next period, by 50 quadrillion units in 2030 . In comparison with petrol and oil, coal and natural gas have had roughly increase over the period with the amount of coal and natural gas respectively by 30 and 23 quadrillion units.
Meanwhile, the USA has consumed nuclear, solar/wind and hydropower quite lower than three above energies. Both nuclear, solar/wind and hydropower started with 3 quadrillion units. But in projection until 2030, nuclear and solar/wind have had small climb in the consumption, by 8 and 6 quadrillion units. In contrast, the quantity of hydropower generated fluctuated from 1980 to 2005 before declined and has remained unchanged at the end of the period, with 3 quadrillion units.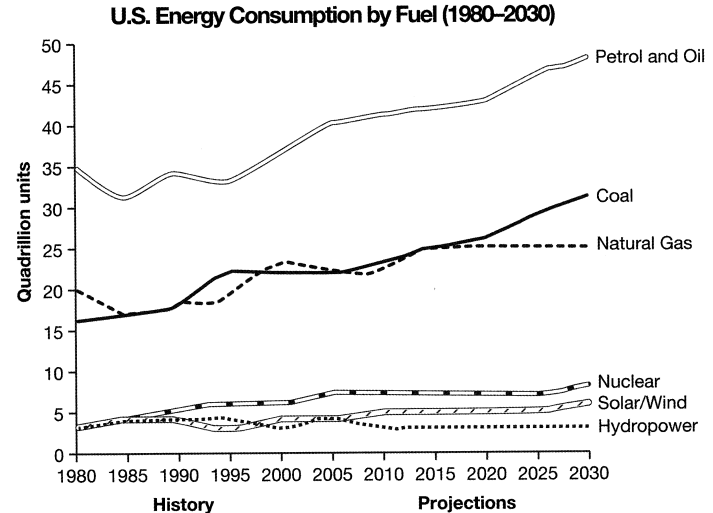
Top answer
The given (Use of "given" or "provided" or any other such word is unnatural) line graph compares the consumption of six different fuels used for energy production energies in the USA in both history and future from 1980 to 203 0. (1980 is not future. 2030 is not history!
- The given (Use of "given" or "provided" or any other such word is unnatural) line graph compares the consumption of six different fuels used for energy production energies in the USA in both history and future from 1980 to 203 0.
- (1980 is not future.
- 2030 is not history!
- You cannot mix this up together.
- It makes no sense.
Get the Weekly English Kit 📬
New words, one handy idiom, and a 2-minute quiz — delivered to your inbox to keep your streak alive.
The given (Use of "given" or "provided" or any other such word is unnatural) line graph compares the consumption of six different fuels used for energy production energies in the USA in both history and future from 1980 to 2030.
 Related Questions