
Writing task 1
Can everyone has a check on my essay, tks a lot!
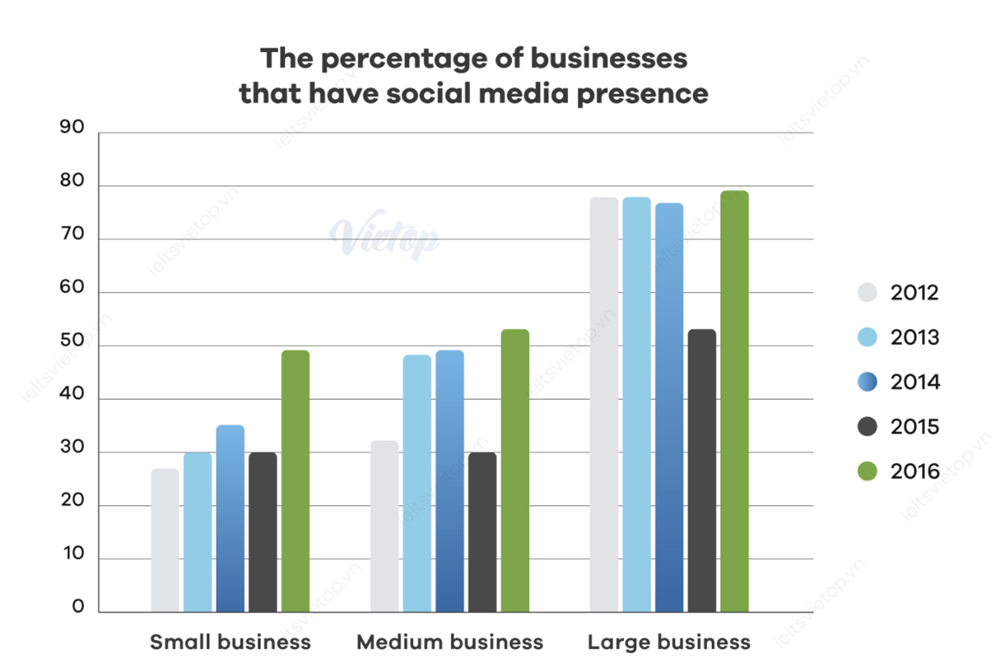
Task 1: The bar chart shows the percentage of small , medium, large companies which used social media for business purposes between 2012 to 2016.
The bar chart illustrates the proportion of different types of companies that applied social media for business aims during 2012 and 2016.
The first initial impression is that three different types of companies experienced an increase over the next 4 years. It is also clear that the largest figures were recorded in large companies.
Between 2012 and 2014 witnessed a slight peak of about 6% in the figure for small businesses and then in the year 2015, the figures for small medium businesses were nearly the same, at around 30%. The similar picture was seen in the figures for medium businesses, with about 50% in 2014, which was nearly 20% higher than the figure in 2012. Besides, the figures for small business was as high as that of medium business in 2016, at about 50% each.
In 2012, the figure for large business stood at about 78%, which underwent a negligible decrease over the next 2 years, at approximately 76% in 2014. Similarly, This figure continued to drop to about 50% in the next year and then it enjoyed an upswing to just below 80% in the year 2016 which was the highest figure can be seen in the chart.
200 words
thanks for your time!
Top answer
Can everyone has a someone check on my essay please? tks Thanks a lot! ---------------------------------------------------- The bar chart illustrates the proportion of differen t- size d types of companies that applied utilized social media for business aims commercial reasons during between 2012 and 2016.
- Can everyone has a someone check on my essay please?
- tks Thanks a lot!
- ---------------------------------------------------- The bar chart illustrates the proportion of differen t- size d types of companies that applied utilized social media for business aims commercial reasons during between 2012 and 2016.
- The first initial impression is that three different types of companies Overall, small and medium companies experienced an increase in social media use, whereas the graph for large companies remained mostly steady.
- over the next 4 years.
Get the Weekly English Kit 📬
New words, one handy idiom, and a 2-minute quiz — delivered to your inbox to keep your streak alive.
Can everyone has a someone check on my essay please? tks Thanks a lot!
----------------------------------------------------
The bar chart illustrates the proportion of different-
 Related Questions