
Writing task 1
The chart below shows the proportions of graduates from Brighton University in 2019 entering different employment sectors.
Summarise the information by selecting and reporting the main features, and make comparisons where relevant.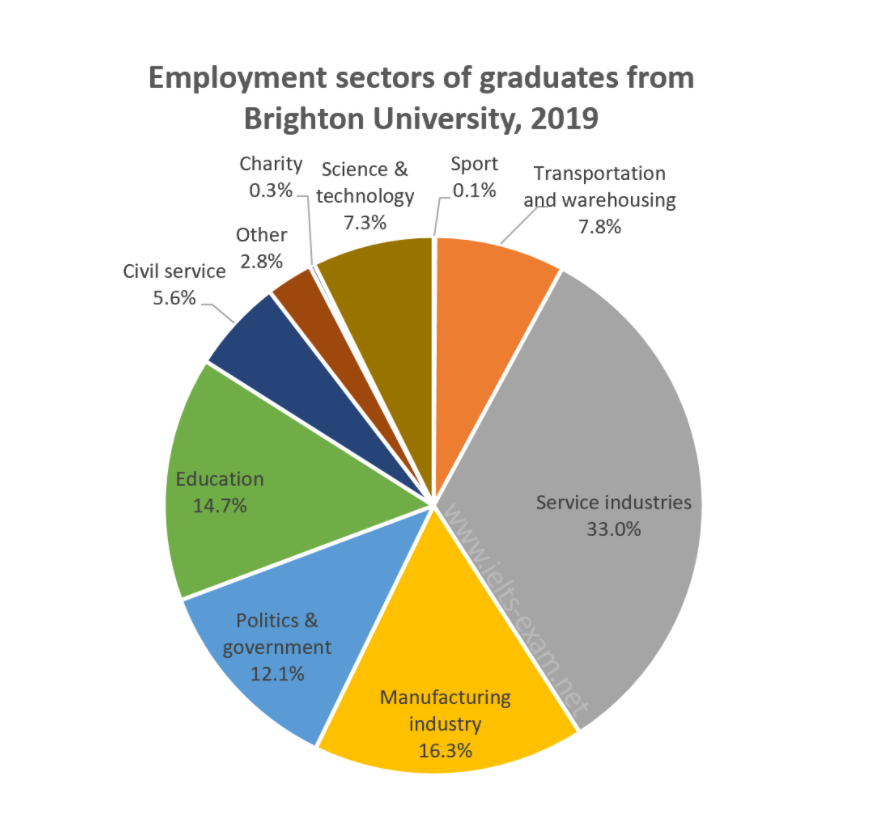
The pie chart compares the percentages of students from Brighton University in the year 2019 choosing their workplace after graduating regarding eight different sectors.
Overall, service industries major is the most prevalent than any other sector. In contrast, the proportions of selecting charity and sport are quite small.
In detail, the first ranked were service industries with the figure being almost a third (33%), followed by the manufacturing industry. It accounted for about half that number of the first one (16.3%). Both education and politics & government are attractive with Brighton graduates, with the percentage at 14.7% and 12.1% respectively.
The next two groups had a relative proportion: science & technology with 7.3%, and transportation & warehousing with 7.8%. The least popular sectors are charity and sport, both of which are selected by under 1% of graduates. In 2019, about 2.8% of students from Brighton University took jobs in another major.
Get the Weekly English Kit 📬
New words, one handy idiom, and a 2-minute quiz — delivered to your inbox to keep your streak alive.
 Related Questions