
Writing task 1
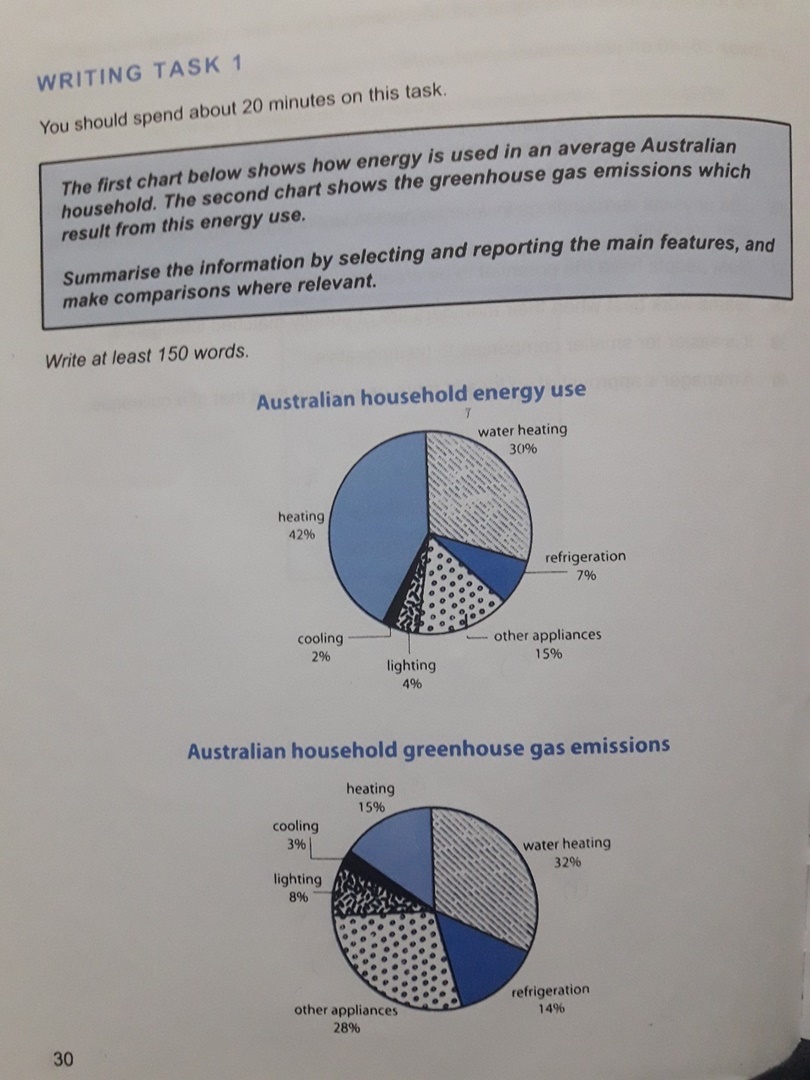
The pie charts illustrate different sections in which energy is used in an average Australian house as well as the greenhouse gas release of each in percentage.
Overall, that biggest amounts of energy are used in heating and water heating. Water heating practices and other appliances are the two most prominent household greenhouse emissions in Australia.
Heating which consumes the greatest percentage of energy (42%) releases 15% of the whole amount of greenhouse gas emissions. However, water heating practices that use the second largest proportion of energy (30%) generate and omit the biggest percentage of greenhouse gases (32%). Other appliances and lighting release greenhouse gases approximately twice as much as the amount of energy they use, 28% compared to 15% and 8% compared to 4%. Cooling builds up only 3% of the whole amount of greenhouse gases emitted to the atmosphere which is 1% more than the 2% of its energy consumption.
WRITE DESCRIPTION HERE
Top answer
The pie charts illustrate different sections in which energy is used in how an average Australian family uses energy in terms of five common categories house as well as the percentage of greenhouse gas release of each of those categories contributes. in percentage. Overall, that biggest amounts of energy are used in heating and water heating.
- The pie charts illustrate different sections in which energy is used in how an average Australian family uses energy in terms of five common categories house as well as the percentage of greenhouse gas release of each of those categories contributes.
- in percentage.
- Overall, that biggest amounts of energy are used in heating and water heating.
- Moreover, w ater heating practices and other appliances are the two most prominent categories in terms of household greenhouse emissions in Australia.
- Heatin g, which consumes the greatest percentage levels of energy (42% ), releases is responsible for 15% of the whole amount of total greenhouse gas emissions.
Get the Weekly English Kit 📬
New words, one handy idiom, and a 2-minute quiz — delivered to your inbox to keep your streak alive.
The pie charts illustrate different sections in which energy is used in how an average Australian family uses energy in terms of five common categories house as well as the percentage of greenhouse gas
 Related Questions