
WRITING TASK 1
Hi there, I am going to take IELTS examination so I really need your help. Please give your comment below. Many thanks!
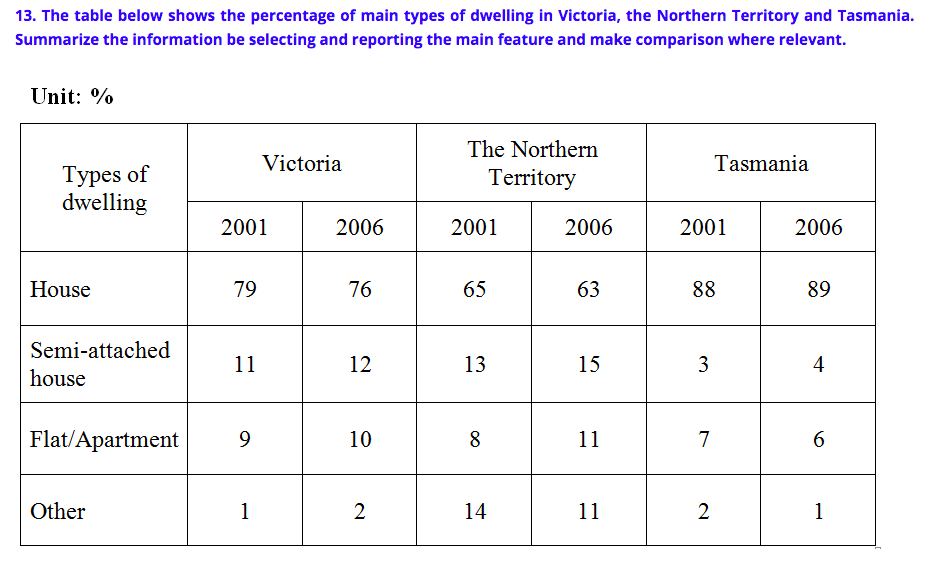
Given are the table comparing the proportion of major kinds of residing in three areas in two years 2001 and 2006. Overall, a slight change in the rates of residential preferences was witnessed in all four dimensions in the period of five years.
It is clear that people liked living in house most in all kinds of places, making up over 60 percent of all three areas. However, house only became more popular in Tasmania, increasing up to nearly 90 percent but in the rest two regions, percentage of people choosing house slightly decreased. By contrast, semi-attached house attracted at least 1 percent more than the figures in 2001, compared to these in 2006.
Besides, flat and other saw reversed patterns in Victoria and Tasmania, rising in Victory and dipping in Tasmania all 1 percent. Finally, those two sectors had the same number of people dwelling in 2006 (11%) though in 2001 only 8% of people chose to live in apartment.
Top answer
You need a lot more practice with Task 1. In Task 1, you have to describe the figure, graph or table without drawing conclusions. This is best done in three paragraphs: an introduction, overall features, and then some details.
- You need a lot more practice with Task 1.
- In Task 1, you have to describe the figure, graph or table without drawing conclusions.
- This is best done in three paragraphs: an introduction, overall features, and then some details.
- Most of your phrases are unnatural, and you use many incorrect vocabulary words.
- Here is a model for this essay : The table gives the percentages of dwelling types in three states of Australia: Victoria, Northern Territories, and Tasmania in two years, 2001 and 2006.
Get the Weekly English Kit 📬
New words, one handy idiom, and a 2-minute quiz — delivered to your inbox to keep your streak alive.
You need a lot more practice with Task 1. In Task 1, you have to describe the figure, graph or table without drawing conclusions. This is best done in three paragraphs: an introduction, overall features, and then some details. Most of your phrases are unnatural, and you use many incorrect vocabulary words.
Here is a model for this essay:
The table gives the
 Related Questions