
Writing Task 1
Hello everyone, my name is William. Please help me correct and mark the following writting for task 1. Much obliged.
The given line chart illustrates the increase in the aging population in three nations Japan, Sweden and the USA during the period between 1940 and 2040.
It is clear from the graph that the percentage of older people will probably continue to increase in the next two decades. A more dramatic rise is predicted between 2030 and 2040 in Japan, by which time it is thought that the proportion of elderly people will be similar in the three nations.
In 1940, the proportion of people aged 65 or more stood at only 5% in Japan, approximately 7% in Sweden and 9% in the US. However, while the figures for the Western countries grew to about 15% in around 1990, the figure for Japan dipped to only 2.5% for much of this period before starting to rise again.
From 1990 to 2040, there was a fluctuation in the percentage of aging population in Sweden. While the figure for Japan was rising slowly, the figure for America was staying at the same level until 2020. It also indicates that the proportion of elderly people in three nations is expected to increase to almost 25% of the respective populations by the year 2040.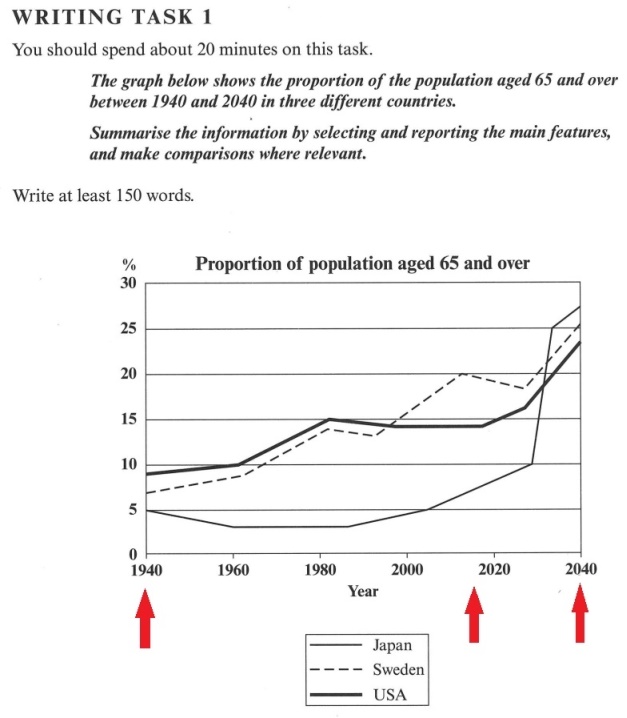
Top answer
The given line chart illustrates the increase in the aging the percentage of people 65 years and older population in three nation s: Japan, Sweden and the USA during the period between 1940 and 2040. It is clear from the graph that the percentage of older people will probably is expected to continue to increase in the next two decades in all three countries . A more dramatic rise is predicted between 2030 and 2040 in Japan, by which time it is thought that the proportion of elderly people will be similar in the three nations.
- The given line chart illustrates the increase in the aging the percentage of people 65 years and older population in three nation s: Japan, Sweden and the USA during the period between 1940 and 2040.
- It is clear from the graph that the percentage of older people will probably is expected to continue to increase in the next two decades in all three countries .
- A more dramatic rise is predicted between 2030 and 2040 in Japan, by which time it is thought that the proportion of elderly people will be similar in the three nations.
- In 1940, the proportion of people aged 65 or more stood at only 5% in Japan, approximately 7% in Sweden and 9% in the US.
- 5% for much of this period before starting to rise again.
Get the Weekly English Kit 📬
New words, one handy idiom, and a 2-minute quiz — delivered to your inbox to keep your streak alive.
The given line chart illustrates the increase in the aging the percentage of people 65 years and older population in three nations: Japan, Sweden and the USA during the period between 1940 and 2040.
It is clear from the graph that
 Related Questions