
Writing task 1
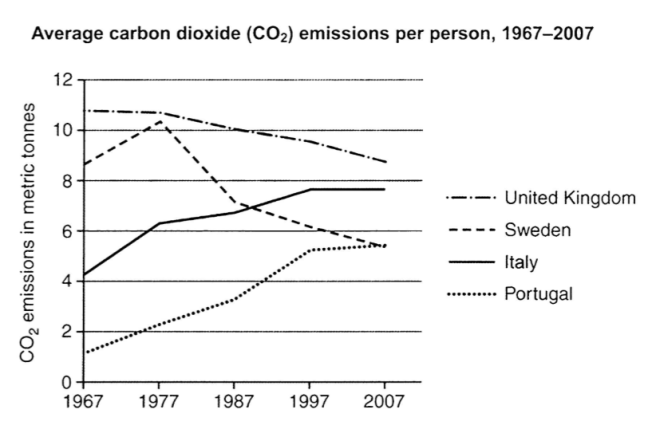
The line graph represents the average amount of CO2 emissions that every person consumes in many countries: UK, Sweden, Italy and Portugal from 1967 to 2007. Overall, throughout 40 years, UK was always the country which had the highest amount of Co2 consumption per person, while Portuguese released the least emissions individually.
From 1967 to 1977, there were upward trends in 3 countries which were Portugal, Italy, Sweden. In 1977, the amount of average consumption per person in such 3 countries was 2 tonnes, just over 6 tonnes, and just over 10 tonnes, respectively. In contrast, UK almost stabilized at nearly 10 tonnes which was the same amount of Sweden.
After 10 years, there were glaring changes in 4 nations. The average rate of CO2 emissions released personally in Portugal continued to rise to 3 tonnes, while the amount in UK saw a gradual downward by 10 tonnes and still a tendency of decrease in later years till 2007. In Italy, the rate climbed; In contrast, in Sweden, its figure plunged. However, 2 figures from 2 countries got at 7 tonnes at the same time. The Italy's amount just kept increasing and not until in 1997, did it remain unchanged. Although the Portuguese's rate was almost unchanged from 1997 and Sweden's rate decreased constantly, the Portuguese's and Swedish's all got the same point in the end the end of 40-year period.
Top answer
The line graph represents (shows, plots) the average amount of CO2 emissions that every person consumes (Wrong word. ) in many countries: UK, Sweden, Italy and Portugal (you need a comma here) from 1967 to 2007. Overall, throughout 40 years, UK was always the country which had the highest amount of Co2 consumption per person, while (missing word) Portuguese released the least emissions individually .
- The line graph represents (shows, plots) the average amount of CO2 emissions that every person consumes (Wrong word.
- ) in many countries: UK, Sweden, Italy and Portugal (you need a comma here) from 1967 to 2007.
- Overall, throughout 40 years, UK was always the country which had the highest amount of Co2 consumption per person, while (missing word) Portuguese released the least emissions individually .
- ) countries which were Portugal, Italy, Sweden.
- In 1977, the amount of average consumption per person in such (wrong word) 3 countries was 2 tonnes, just over 6 tonnes, and just over 10 tonnes, respectively.
Get the Weekly English Kit 📬
New words, one handy idiom, and a 2-minute quiz — delivered to your inbox to keep your streak alive.
The line graph represents (shows, plots) the average amount of CO2 emissions that every person consumes (Wrong word. Consume means eat.) in many countries: UK, Sweden, Italy and Portugal (you need a comma here) from 196
anhpjthat every person consumes in many countries: UK,
that every person consumes in many countries: the UK,
anhpjOverall, throughout 40 years, UK was always
Overall, throughout 40 years, the UK was always
 Related Questions