
Writing task 1
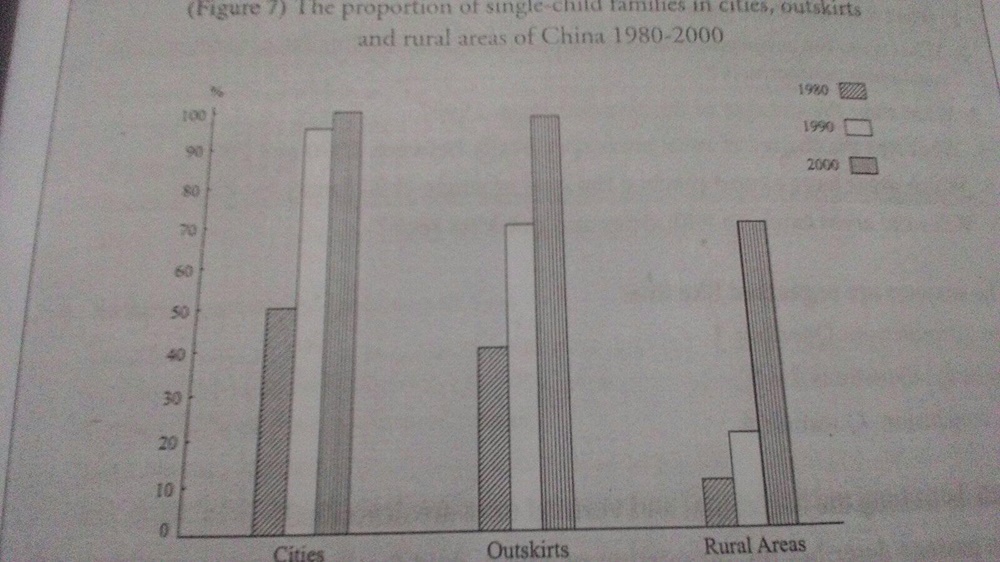
The bar chart compares Chinese cities, outskirts and rural areas in term of the percentage of one – child families over the perod of 20 years.
Overall, the proportion of families who have one child in three different areas of China increase over the shown time; meanwhile, the figure for that in the rural areas was by far the lowest.
In the year 1980, cities had the highest single – child families rate, with exactly 50%, compared with 40% for that in the outskirts and only 10% in the rural areas.
By 2000, there was almost a table remain in the percentage of those families, with 100%, after a peak from 50% to approximately 95% in 1990. At the same time, the proportion of that in the outskirts continued to rise, from 70% in 1990 to approximately 97%. The data saw a sharp rise in this rate in the reural areas, with a jump from 17% in 1990 to exactly 10%
Top answer
The bar chart compares Chinese cities, outskirts and rural areas in term of the percentage of single-c h ild families over the perod of 20 years. (The data was not continuous for 20 years. ) Overall, the proportion of families who had one child in three different areas of China increase over the shown time; meanwhile , but the figure for that in the rural areas was by far the lowest.
- The bar chart compares Chinese cities, outskirts and rural areas in term of the percentage of single-c h ild families over the perod of 20 years.
- (The data was not continuous for 20 years.
- ) Overall, the proportion of families who had one child in three different areas of China increase over the shown time; meanwhile , but the figure for that in the rural areas was by far the lowest.
- ) with exactly 50%, compared with 40% for that in the outskirts and only 10% in the rural areas.
- ) in the percentage of those families, with 100%, after a rise peak from 50% to approximately 95% in 1990.
Get the Weekly English Kit 📬
New words, one handy idiom, and a 2-minute quiz — delivered to your inbox to keep your streak alive.
The bar chart compares Chinese cities, outskirts and rural areas in term of the percentage of single-child families over the perod of 20 years. (The data was not continuous for 20 years. Please give the year for which data was provided.)
 Related Questions