
Writing task 1
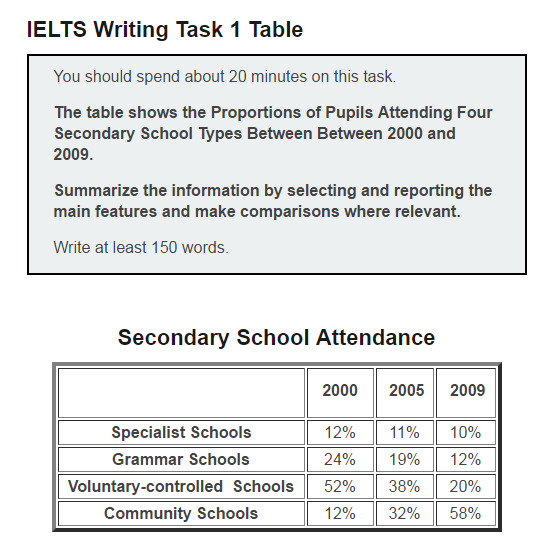
The table illustrates the percentage of students studying in four types of secondary school over a period of nine years, beginning in the year 2000.
It is noticeable that voluntary-controlled schools received by far the most students over the first five years. However, the number of learners choosing to study in community schools significantly increased over the period shown and subsequently overtook that of voluntary-controlled school in 2009.
In 2000, the figure for learners studying in voluntary-controlled schools was the highest, at 52%, compared to 24% students studying in grammar schools. By contrast, specialist schools and community schools received the lowest number of students, at only 12%.
Over the following nine years, community schools saw a significant rise in the number of learners and reached the highest level of 58% students in 2009. As of 2009, the figure for students attending specialist schools was still under 12%, lower than that of any other schools.
Top answer
Help me pls!!
- Help me pls!!
Get the Weekly English Kit 📬
New words, one handy idiom, and a 2-minute quiz — delivered to your inbox to keep your streak alive.
The table illustrates the percentage of students studying in four types of secondary school over a period of nine years, beginning in the for the years 2000, 2005 and 2009.
It is noticeable notable that voluntary-controlled schools received by far had the most students at the start. over the first five years.
 Related Questions