
Writing task 1
The graph shows the changes in the 65-and-over-year-old groups among the UK nations in 1985 and the speculations for 2035.
Overall, the population of the elderly in all 5 countries only accounted for a small percentage of the whole population. According to some statistics, the figures would experience fast growths in the next 50 years.
In 1985, Wales ranked first with the highest number of the old, 16%- 1% more than the figure for the UK. The ageing population of England was precisely equal to the UK. 14% and 12% were the proportions of the aged living in Scotland and Northern Ireland respectively, and both were lower than the average of the whole four.
By 2035, the research institutions forecast sharp rises in the percentage of individuals aged 65 and over. Wales would continue to hold the first place with a figure of 26%, 3% higher than the UK. England and Northern Ireland would witness ageing processes as they would be homes to the increasing numbers of the old, which would be up to 23% similar to the UK’s. Scotland’s figure would see an upward trend and slightly surpass the UK.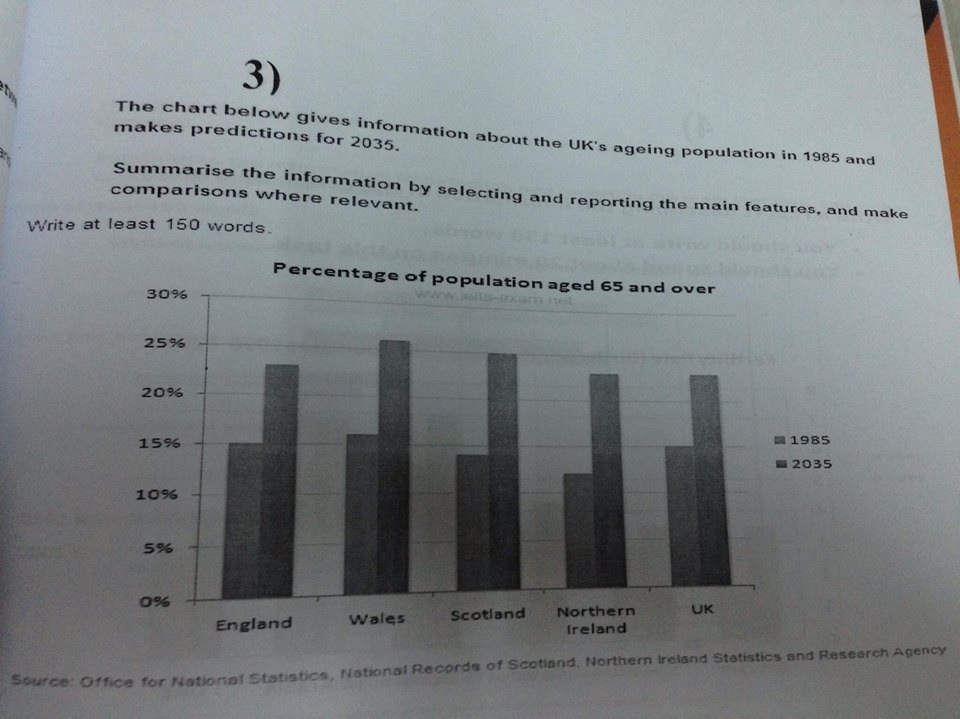
Top answer
) in the 65-and-over-year-old groups among the UK nations in 1985 and the speculations for 2035. Overall, the population of the elderly in all 5 countries only accounted for a small percentage of the whole population. According to some statistics, the figures would experience fast growths in the next 50 years.
- ) in the 65-and-over-year-old groups among the UK nations in 1985 and the speculations for 2035.
- Overall, the population of the elderly in all 5 countries only accounted for a small percentage of the whole population.
- According to some statistics, the figures would experience fast growths in the next 50 years.
- In 1985, Wales ranked first with the highest number of the old, 16%- 1% more than the figure for the UK.
- The ageing population of England was precisely equal to the UK.
Get the Weekly English Kit 📬
New words, one handy idiom, and a 2-minute quiz — delivered to your inbox to keep your streak alive.
The graph shows the changes (What is changing in 1985?) in the 65-and-over-year-old groups among the UK nations in 1985 and the speculations for 2035.
Overall, the population of the elderly in all 5 countries only accounted for a small percentage of the whole population. According to some statistics, the figures would experience fast g
 Related Questions