
Writing Part 1 IELTS - Line graph, Proportion of population
Thanks for your time and kindness. I'm still trying my best to improve my skills so I really appreciate all your feedback and advice.
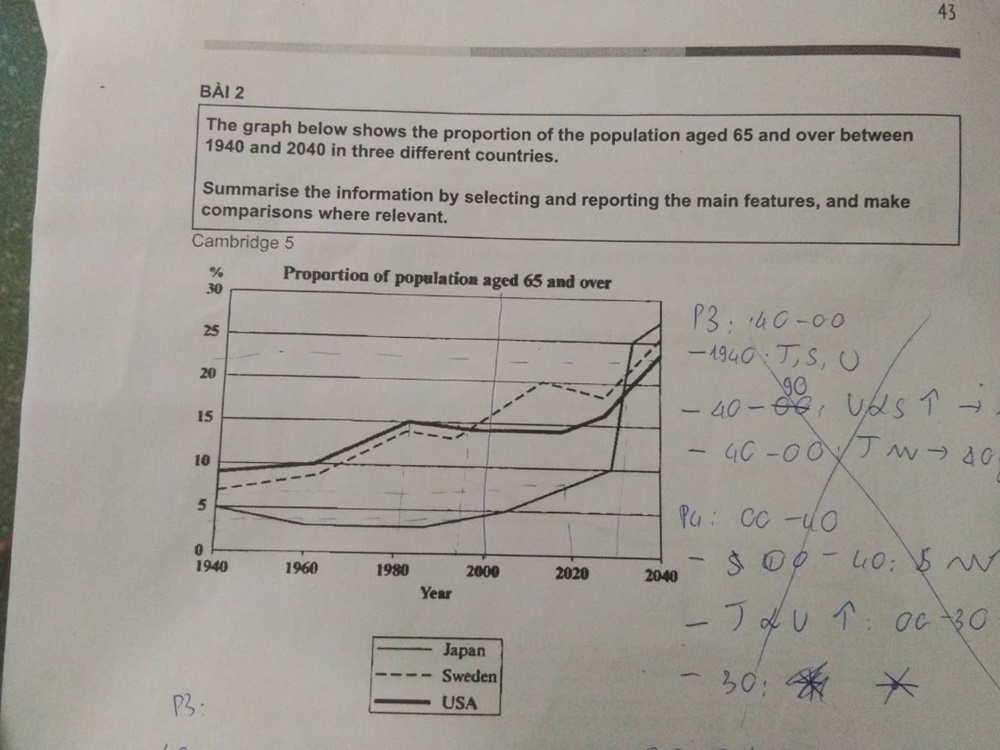
The line graph shows the proportion of people aged 65 and over from 1940 to 2040 in Japan, Sweden, and the USA.
Overall, the percentages of those people in the three countries will continue to increase until 2040. The rank of Sweden will remain the same by the end of the period, while Japan will overtake the USA and end in the first place.
In 1940, the USA had under 10% of people aged 65 and over, about 1.3 to 2 times as high as Sweden and Japan. In the next 40 years, these percentages in the USA and Sweden rapidly increased and ended at around 15% and 13%, respectively. On the other hand, after a decreasing phrase until 1960, Japan showed little changes and reached about 3% in 1980.
In the late 90s, the figures for the USA and Sweden were equal at approximately 15%. Until 2020, there has been an increase in the percentages of the population aged 65 and over in Sweden and Japan. By contrast, the proportion in the USA has leveled off. After reaching an equal value in 2030, all three countries will likely keep increasing and end at over 23% by 2040.
Get the Weekly English Kit 📬
New words, one handy idiom, and a 2-minute quiz — delivered to your inbox to keep your streak alive.
 Related Questions