
Writing Part 1 IELTS - Line graph, Goods transported in UK
Thanks for making time for me. I appreciate all your help and kindness.
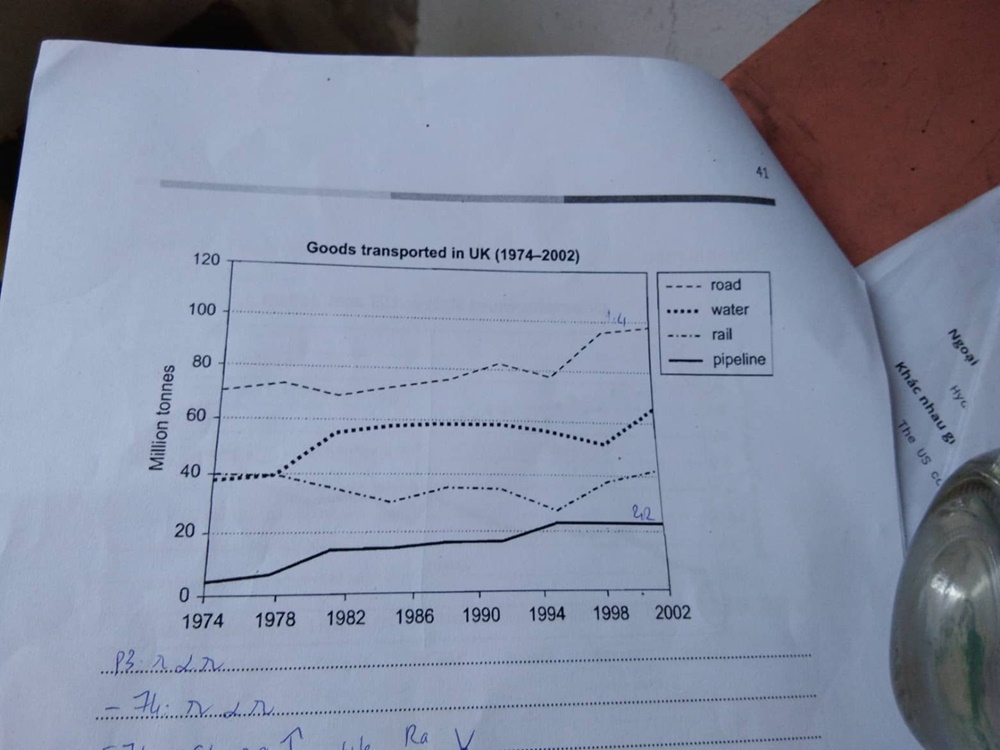
The line graph shows the number of goods transported in the UK by four means: road, water, rail, and pipeline from 1974 to 2002.
Overall, by the end of the period, rail-transported goods were the only ones to remain within a tight range at approximately the same value. The other three all increased by a factor of about 1.4 to 2.2. The ranks of road and pipeline didn't change over the entire time, while water took over rail's place and ended at third.
In 1974, around 70 million tonnes of goods were transported by road, about 175% of rail's value. While rail-transported goods hit a low in 1995, there was only a slight decrease in the number of road-transported ones. From that point, goods transported by road were increasingly popular, and the figure stood at nearly 100 million tonnes in 2002, almost 2.5 times as high as rail's value.
Between 1974 and 1982, there was an upward trend in both the numbers of goods transported by water and pipeline. However, in the next ten years, these two showed little changes. At this point, the figures were nearly 60 million tonnes and 19 million tonnes, respectively. Although the last ten year of the period saw ups and downs in both water-transported and pipeline-transported goods, pipeline remained the least common means of transport with only around 21 million tonnes, approximately 1/3 of water's value.
Top answer
The line graph shows the number volume of goods transported in the UK by four means: road, water, rail, and pipeline from 1974 to 2002. [ 1] Overall, by the end of the period, rail-transported goods were the only ones to remain within a tight range at approximately the same value. 2.
- The line graph shows the number volume of goods transported in the UK by four means: road, water, rail, and pipeline from 1974 to 2002.
- [ 1] Overall, by the end of the period, rail-transported goods were the only ones to remain within a tight range at approximately the same value.
- 2.
- The ranks of road and pipeline didn't change over the entire time, while water took over rail's place and ended at third .
- Moreover, road transport carried the most tonnage, whereas pipeline accounted for the least, with water and rail in between.
Get the Weekly English Kit 📬
New words, one handy idiom, and a 2-minute quiz — delivered to your inbox to keep your streak alive.
The line graph shows the number volume of goods transported in the UK by four means: road, water, rail, and pipeline from 1974 to 2002.
[ 1]
Overall, by the end of the period, rail-transported goods were the only ones to remain within a tight range at approximately the same value. The other three
The graph demonstrates the amount of goods conveyed in UK throughout the period of time from 1974 to 2002 by road, water, rail and pipeline transport.
Regarding the illustrations on the graph , it is clearly seem that the amount of commodities lifted by road ways increased consistently to approxima
 Related Questions