
Writing IELTS Task 1 - Please help me with this
.
My report:
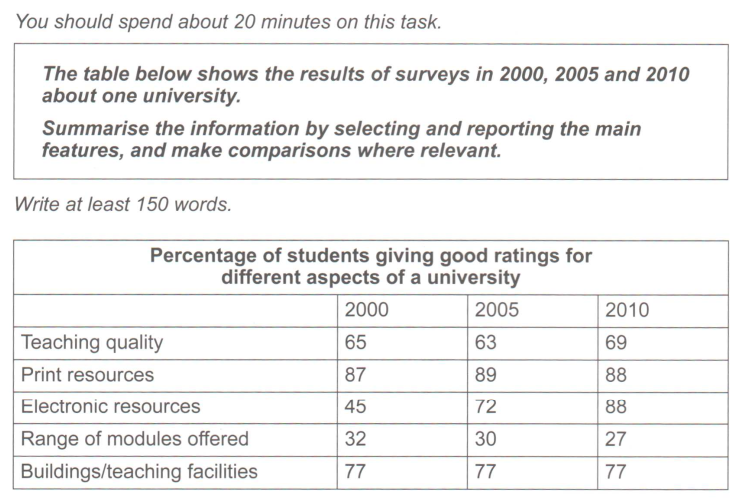
The chart shows how students ratings for several categories of a university changed over time in three different years, 2000, 2005 and 2010. Overall, while the good ratings given for teaching quality, electronic resources and other aspects rose slightly, there was an opposite trend for the range of modules offered's figures.
In 2000, the proportion of students rating for electronic was relatively low, at only 45%, followed by a sharp increase in the next five years and reached a peak of 88%. Meanwhile, the figure for print resources was the highest in the beginning, at up to 87%, but then dropped by 1% after increasing to 89% in 2005.
The percentage of students giving good ratings for teaching quality grew modestly, from 65% to 69% although 2005 experienced a slight drop of only 2%. By contrast, there was a steady decline in the number of students voting for the range of modules offered. The figure for building/teaching facilities remained unchanged from 2001 to 2010, at 77%.
166 words, written in 19 minutes.
Many thanks
Top answer
The chart shows how students ratings for several (How many? ) categories of a university changed over time in three different years, 2000, 2005 and 2010. ) rose slightly, there was an opposite trend for the range of modules offered's figures.
- The chart shows how students ratings for several (How many?
- ) categories of a university changed over time in three different years, 2000, 2005 and 2010.
- ) rose slightly, there was an opposite trend for the range of modules offered's figures.
- ) of 88%.
- ) in the beginning, at up to 87%, but then dropped by 1% after increasing to 89% in 2005.
Get the Weekly English Kit 📬
New words, one handy idiom, and a 2-minute quiz — delivered to your inbox to keep your streak alive.
The chart shows how students ratings for several (How many? Be precise.) categories of a university changed over time in three different years, 2000, 2005 and 2010. Overall, while the (missing words) good ratings given for teaching quality, electronic resources and other aspects (That is not a category.) rose slightly, there was an opposite trend for the
 Related Questions