
Writing IELTS Task 1.
Can you please check my work? Thank you in advance.
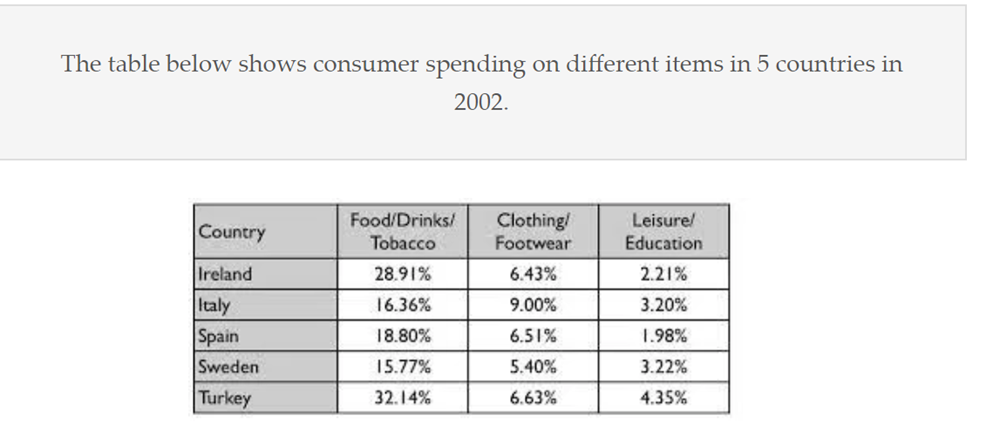
The table compares the proportions of income spent on different categories in 5 nations in 2002.
Overall, people in all 5 countries spent the highest percentage of their income on food/drinks/tobacco and considerably less on clothing/footwear and leisure/education.
In terms of food/drinks/tobacco, consumers in Ireland and Turkey spent the highest proportion of their income with 28.91% and 32.14%, respectively. However, Spanish residents spent only 18.80% on this item, as opposed to 16.36% by the Italian and 15.77% by the Swedish people. In contrast, people in all 5 countries spent much lower amounts of money on clothing/footwear. Italian households spent a proportion of 9.00% on this category, while Irish, Spanish and Turkish people spent nearly the same amounts of money on this item of around 6.5%. Likewise, residents in Sweden spent only 5.40% of their income on clothing/footwear.
With regards to leisure/education, the figures for 5 countries are the lowest. In Turkey, people spent 4.35% of their wages on this item, compared to 3.22% in Sweden and 3.20% in Italy. People in the two remaining country spent even lower percentages of their income on this category with 2.21% by the Irish and and 1.98% by the Spanish people.
Top answer
) in 2002. Overall, people in all 5 countries spent the highest percentage of their income on food/drinks/tobacco (That is probably not true. Do you know why?
- ) in 2002.
- Overall, people in all 5 countries spent the highest percentage of their income on food/drinks/tobacco (That is probably not true.
- Do you know why?
- ) and considerably less on clothing/footwear and leisure/education.
- 14%, respectively.
Get the Weekly English Kit 📬
New words, one handy idiom, and a 2-minute quiz — delivered to your inbox to keep your streak alive.
The table compares the proportions of income spent on different (how many?) categories in 5 nations (which nations?) in 2002.
Overall, people in all 5 countries spent the highest percentage of their income on food/drinks/tobacco (That is probably not true. Do you know why? ) and considerably less on clothing/footwear and leisure/education.
In terms of fo
 Related Questions