
Wring task 1 - Please help me check it
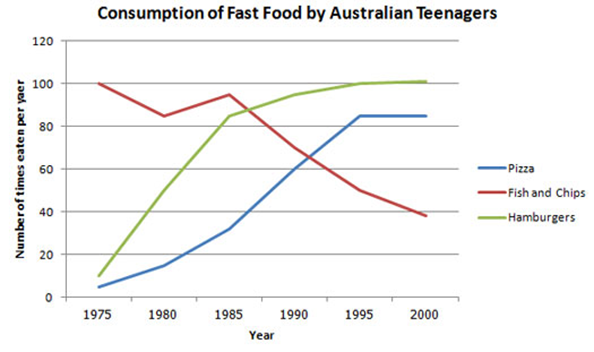
The chart shows the statistics on the quantity of three different types of fast food that were consumed by Australian teenagers between 1975 and 2000. Overall, it is obvious that pizza and hamburgers were eaten more and more frequently while there was a gradual fall in the consumption of fish and chips.
Looking first at the green line, the number of times hamburgers were in eaten in a year rapidly increased from approximately 10 to more than 80 during the period of 1975 to 1985. Over the next 10 years, it continued to rise considerably before reaching the plateau of 100 from 1995 to 2000.
Regarding the consumption of pizza, it began with the low quantity in 1975 but there was a steady growth of about 16 times from 5 to more than 80 during the latter 20 years. This considerable increase was followed by a stable period during the next 5 years.
In contrast, fish and chips were most consumed among the rest in 1975 with 100 times eaten a day, but then their consumption had fluctuated for the following 10 years before dived steeply to a low of less than 40 in 2000.
Top answer
Here are my suggestions (if they are still useful): The chart shows the statistics on the quantity of three different types of fast food that were consumed by Australian teenagers between 1975 and 2000. [ New paragraph ] Overall, it is obvious that pizza and hamburgers were eaten more and more frequently while there was a gradual fall in the consumption of fish and chips. Looking first at the green line , T he number of times hamburgers were in eaten in a year (shown by the green line) rapidly increased from approximately 10 to more than 80 during the period of 1975 to 1985.
- Here are my suggestions (if they are still useful): The chart shows the statistics on the quantity of three different types of fast food that were consumed by Australian teenagers between 1975 and 2000.
- [ New paragraph ] Overall, it is obvious that pizza and hamburgers were eaten more and more frequently while there was a gradual fall in the consumption of fish and chips.
- Looking first at the green line , T he number of times hamburgers were in eaten in a year (shown by the green line) rapidly increased from approximately 10 to more than 80 during the period of 1975 to 1985.
- Over the next 10 years, it continued to rise considerably before reaching the plateau of 100 from during the period 1995 to 2000.
- ] Regarding T he consumption of pizza , it began with the low quantity of 5 in 1975 but showed there was a steady growth, rising of about 16 times from 5 to more than 80 during the next latter 20 years-- a sixteen-fold increase .
Get the Weekly English Kit 📬
New words, one handy idiom, and a 2-minute quiz — delivered to your inbox to keep your streak alive.
Here are my suggestions (if they are still useful):
The chart shows the statistics on the quantity of three different types of fast food that were consumed by Australian teenagers between 1975 and 2000.
[New paragraph] Overall, it is obvious that pizza and hamburgers were eaten more and more frequently while there was a gradual fall in the consumption of fish and chip
 Related Questions