
Women and men in one Asian country who passed when they took their driving test between 1980 and 2010.
The given chart compares the percentage of people who passed when they take their driving test in one Asian country from 1980 to 2010, with units measured in per cent.
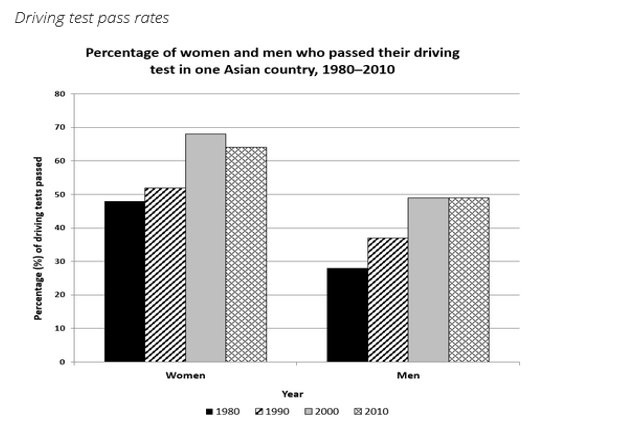
Overall, the survey witnessed the percentage of people passed their driving test increased significantly over the period. Moreover, the figure for women was higher than that of man.
It is evident that the proportion of women passed their driving test was 48% in 1980 before the figure for this saw an increased slightly to 52% in 1990. After that, the amount of women passed the testing drive was highest in the survey, rose significantly to 68% in 2000, and turning to drawback with 64% at the end of the survey (2010).
Turning to the data of man, the proportion of men passed their driving test was 28% in 1980, lower than that of women in the same year. The year 1990 saw an increased significantly to 38% and the figure for this had raised significantly to 49% in 2000. Following in 2010, the figure for this was remained at the end of period.
Top answer
Please do not put the essay instructions in the "Subject" line. Put it with your answer in the message body. Subject: Please review my IELTS essay Message body: Topic: The chart below gives information about the number of social networking sites people used in Canada in 2014 and 2015.
- Please do not put the essay instructions in the "Subject" line.
- Put it with your answer in the message body.
- Subject: Please review my IELTS essay Message body: Topic: The chart below gives information about the number of social networking sites people used in Canada in 2014 and 2015.
- Copy the instructions accurately and completely.
- ) --------------------- Please read my advice for Task 1 essays.
Get the Weekly English Kit 📬
New words, one handy idiom, and a 2-minute quiz — delivered to your inbox to keep your streak alive.
Please do not put the essay instructions in the "Subject" line.
Put it with your answer in the message body.
Subject: Please review my IELTS essay
Message body:
Topic:
The chart below gives information about the number of social networking sites people used in Canada in 2014 and 2015.
Copy the instructions accurately and completely.
NguyenDucToan HL The given chart
The given (Do not use "given", "provided" or other such word. It is not natural English. ) chart (What kind of chart is this? Read my advice for types of charts.)
NguyenDucToan HL
 Related Questions