
Weather Forecasts
The diagram below shows how the Australian Bureau of Meteorology
collects up-to-the-minute information on the weather in order to produce
reliable forecasts.
Write a report for a university lecturer describing the information shown
below.
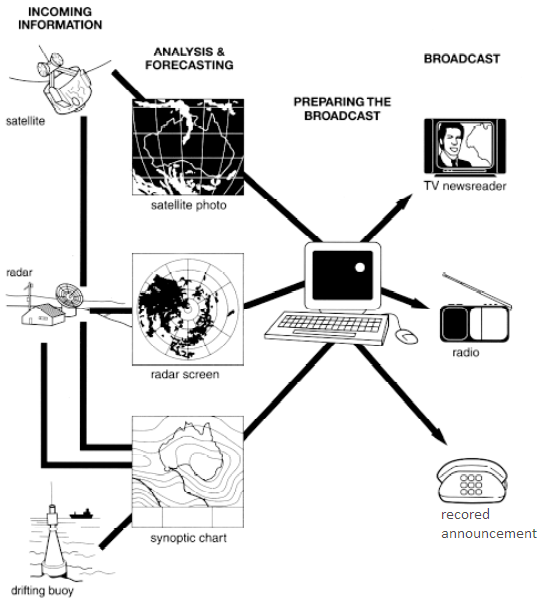
The diagram highlights the process of data collection, analyzing and generating dependable weather report by the Australian Bureau of Meteorology before releasing it to the public.
Generally, pictures from satellite, radar screen and synoptic chart made with the help of drifting buoy are processed with the help of a computer, to communicate the forecast through electronic media.
First, the climate condition of Australia, in the form of the picture taken through satellite is analyzed either directly or along with two other sources. On the other hand, data framed on the radar screen and the synoptic chart are actually made through the use of all three sources together. It is clear that radar is actually providing a hub for information; any information transfer between synaptic chart and satellite has to go through it.
At the second step, all the data is mapped on screen, chart, and photo for further analysis and forecasting. At the next level, this data is put in the order with the help of a computer for broadcasting. Finally, the forecast is released through three different means: TV news, radio and recorded telephonic announcement.
Top answer
The diagram highlights the process of data collection , analyzing and analysis by the Australian Bureau of Meteorology for generating dependable weather repor ts by the Australian Bureau of Meteorology before releasing it them to the public. Generally, pictures from satellit es , radar scree ns and synoptic char ts made with the help of drifting buoy are processed with the help of a computer, to communicate the forecast through electronic media. First, the climate weather condition of Australia, in the form of the pictu res taken through satellit es, sea buoys or radar is analyze d.
- The diagram highlights the process of data collection , analyzing and analysis by the Australian Bureau of Meteorology for generating dependable weather repor ts by the Australian Bureau of Meteorology before releasing it them to the public.
- Generally, pictures from satellit es , radar scree ns and synoptic char ts made with the help of drifting buoy are processed with the help of a computer, to communicate the forecast through electronic media.
- First, the climate weather condition of Australia, in the form of the pictu res taken through satellit es, sea buoys or radar is analyze d.
- either directly or along with two other sources.
- On the other hand, data framed on the radar screen and the synoptic chart are actually made through the use of all three sources together.
Get the Weekly English Kit 📬
New words, one handy idiom, and a 2-minute quiz — delivered to your inbox to keep your streak alive.
The diagram highlights the process of data collection , analyzing and analysis by the Australian Bureau of Meteorology for generating dependable weather reports by the Australian Bureau of Meteorology before releasing it them to the p
 Related Questions