
This is my writing task 1. Please help me correct all my mistakes. Thank you very much.
Answer
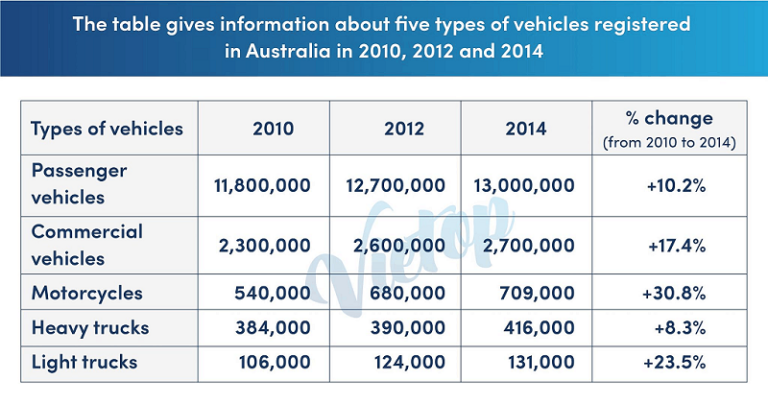
The table compares 5 different means of transportation that were enrolled in australia in 3 different years (2010, 2012, and 2014)
Overall, it can be easily seen that the number of all 5 types of vehicles went up over the period. In addition, the figure of passenger vehicles ranked first in all 3 years, while motorcycles saw the most dramatic increase.
In the first year, there was a huge number of individuals who registered passenger vehicles with 11.8 million commercial ones was significantly lower at only 2.3 million. Onver the next four yeara, the passenger vehicles number rose by 10.2% to 13 million, whereas there were 0.4 million more commercial vehicles registered, an increase of 17.4%.
Throwing back to the remaining types of transportation, the greastest increase was recorded for motorcycles, which grew from 540,000 in 2010 to 709,000 in the last year, a rise of 30.8%. During the same period, the number of heavy and light trucks witnessed a gradual growth and heavey trucks’ figure was three folds than light trucks’ one. Nevertheless, the proportion’s change of two types vehicles were very unequal (8.3% and 23.5% respectively)
Top answer
This is very similar to the text in the following link. htm Are you the same person, or did you try to paraphrase that text?
- This is very similar to the text in the following link.
- htm Are you the same person, or did you try to paraphrase that text?
Get the Weekly English Kit 📬
New words, one handy idiom, and a 2-minute quiz — delivered to your inbox to keep your streak alive.
This is very similar to the text in the following link.
https://www.englishforums.com/English/PleaseReviewWritingTask/bpgjqn/post.htm
Are you the same person, or did you try to paraphrase that text?
 Related Questions