
This is my other essay. Could you please help me to correct it and Do you think I can get how many score with this essay? Thank you.
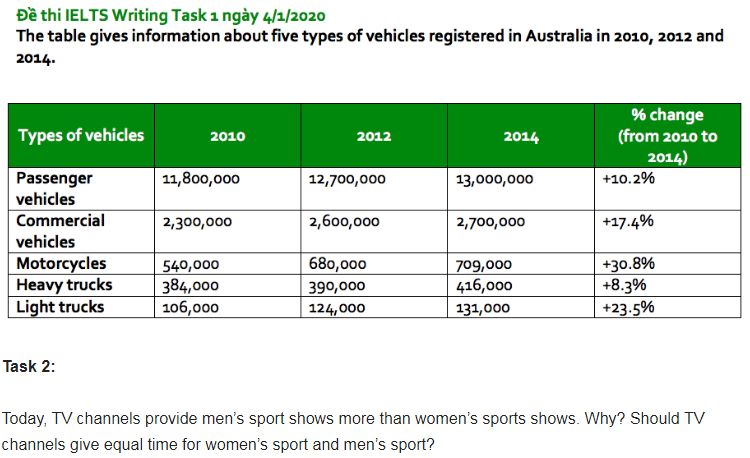
The given chart lists the data relating to five kinds of means of transports that were registered in Australia in three different years 2010, 2012, and 2014.
Overall, the datas on five types of vehicles registered went up during the period. In particular, the registration of passenger vehicles was always the highest compared to other vehicles.
To begin with, the passenger vehicles’s registration was 11,8 million in the starting year, and it rose rapidly to 13 million in 4 years later, which was also the largest number compared to others, that means % change was 10,2%. Furthermore, the number of commercial vehicles made up 2,3 million in 2010, which was followed by a climb to 2,7 million in the final year, as well as the changing percentage was 17,4%.
In addition, the proportions of motorcycles, heavy trucks and light trucks accounted for 540,000, 384,000 and 106,000 respectively in 2010. Besides, these figures climbed to 709 thousand, 416 thousand and 131 thousand orderly in 2014. Finally, the changing percentage of heavy trucks was just 8,3%, while motorcycles and light trucks were significantly higher, at 30,8% and 23,5% in order.
Top answer
The given (Using "given" or "provided" or "above" or "below" is not good. ) chart (wrong word. Learn the names of all the possible figures.
- The given (Using "given" or "provided" or "above" or "below" is not good.
- ) chart (wrong word.
- Learn the names of all the possible figures.
- ) lists the data (The word is ok, but data is very very general.
- ) relating to five kinds of means of transports (Not good.
Get the Weekly English Kit 📬
New words, one handy idiom, and a 2-minute quiz — delivered to your inbox to keep your streak alive.
The given (Using "given" or "provided" or "above" or "below" is not good. ) chart (wrong word. Learn the names of all the possible figures. Use the correct names.) lists the data (The word is ok, but data is very very general. Write specifically what is in the table.) r
 Related Questions