
This is my Ielts writing task 1. Could you please review it? Thank you so much.
The chart below shows the percentage of people of different age groups who went to cinema once a month or more in one European country from 2000 to 2011.
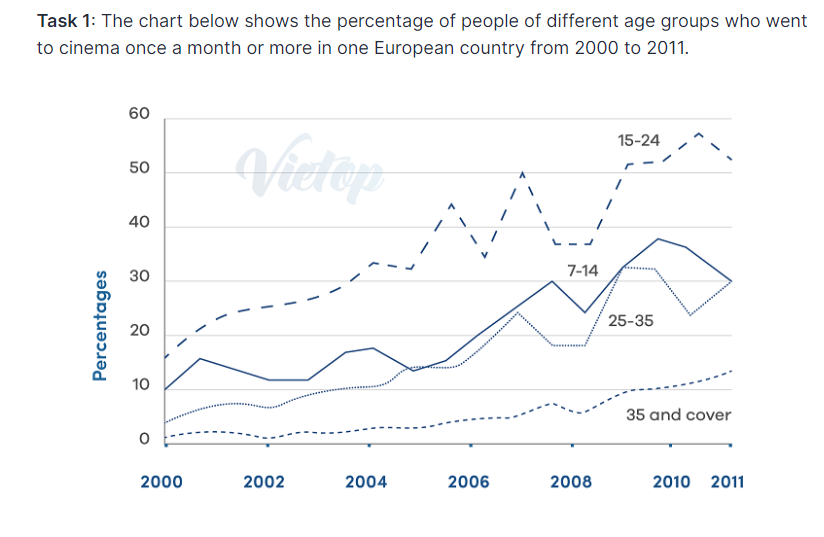
The line graph compares the proportions of people going to the cinema once or more than once a month in an unspecified European country between 2000 and 2011.
Overall, the rates of all ages generally increased with the people aged between 15 and 25 going to the cinema more often than other age groups and the 35 and over is the only group that had consistent growth throughout the period.
In 2000, around 15% of the 15-to-24-year-old people went to the cinema once a month or more, and this figure continued to rise, reaching roughly 45% by 2006. During the same period, similar patterns could be observed with 25-to-35 and 35 and over groups, from 5% to 15%, and 2% to 5%, respectively. Those who aged between 25 and 35 also increased by 10% to 20% in 2006.
From 2006 to 2011, the figure for the 15-to-24 age fluctuated before finishing off at 52% in 2011. The percentage of the 7-14 and the 25-35 groups also fluctuated greatly, before both reaching 30% in 2011. The rate of the 35 and over, rose gradually and ended up at roughly 14% at the end of the period.
Get the Weekly English Kit 📬
New words, one handy idiom, and a 2-minute quiz — delivered to your inbox to keep your streak alive.
 Related Questions