
The table below gives information on consumer spending on different items in five different countries in 2002
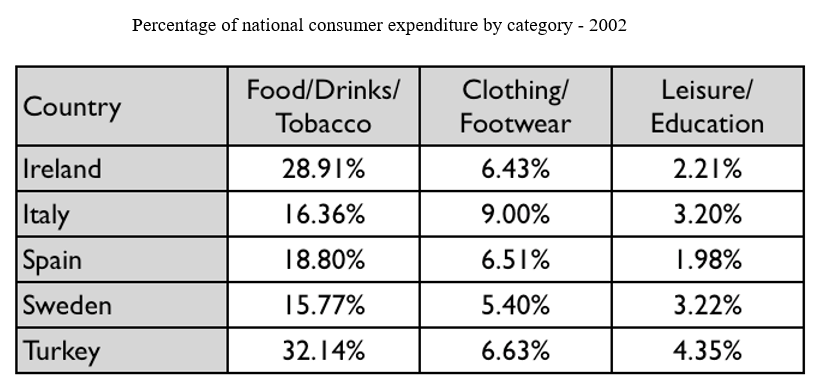
The table chart demonstrates the proportion of three major groups of items which are purchased by customers in five countries, namely, Ireland, Italy, Spain, Sweden and Turkey in 2002.
It is clear that food, drinks and tobacco are some items which are the most consumed while leisure and education are the least.
Irish and Turkish spent more money on food/drinks/tobacco, which is account for 28.91% and 32.14% respectively, than three other countries. Percentages of Italy, Spain and Sweden consumer expenditure on food/drinks/tobacco are roundly 17%.
In comparison, percentages of food/drinks/ tobacco spending higher than percentages of clothing, footwear and leisure, education spending combined. Money spending on leisure/education accounted for around 3%, meanwhile, it is nearly 7% of clothing and footwear. Also, Italy had highest percentages of national consumer expenditure for clothing/footwear, at 9%. For leisure and education, Spain had the lowest figure, at only 1.98%.
Top answer
The table chart demonstrates outlines the proportion of total expenditure for three major groups of items which are purchased by customers broad categories in five countries, namely, Ireland, Italy, Spain, Sweden and Turkey in 2002. It is clear people in all the given countries spent the most on that the category of food, drinks and tobacc o, are some items which are the most consumed while leisure and education are accounted for the least proportion of their total expenditure . 14% respectively, more than the other three other countries.
- The table chart demonstrates outlines the proportion of total expenditure for three major groups of items which are purchased by customers broad categories in five countries, namely, Ireland, Italy, Spain, Sweden and Turkey in 2002.
- It is clear people in all the given countries spent the most on that the category of food, drinks and tobacc o, are some items which are the most consumed while leisure and education are accounted for the least proportion of their total expenditure .
- 14% respectively, more than the other three other countries.
- The p ercenta ge for of Italy, Spain and Sweden consumer of expenditure on food/drinks/tobacco are roundly was roughly 17% in each country .
- It is also notable that in all five countries, the expenditure on In comparison, percentages of food/drinks/ tobacco spending was higher than percentages of for the categories of clothin g/ footwear and leisur e/e ducation spending combined.
Get the Weekly English Kit 📬
New words, one handy idiom, and a 2-minute quiz — delivered to your inbox to keep your streak alive.
The table chart demonstrates outlines the proportion of total expenditure for three major groups of items which are purchased by customers broad categories in five countries, namely, Ireland, Italy, Spain, Sweden and Turkey in 2002.
It is clear people in all the given countries spent the most on that the category of food
 Related Questions