
The pie chart shows the information about world water resources, and the bar chart shows the utilization of water in Egypt, Saudi Arabia and Canada
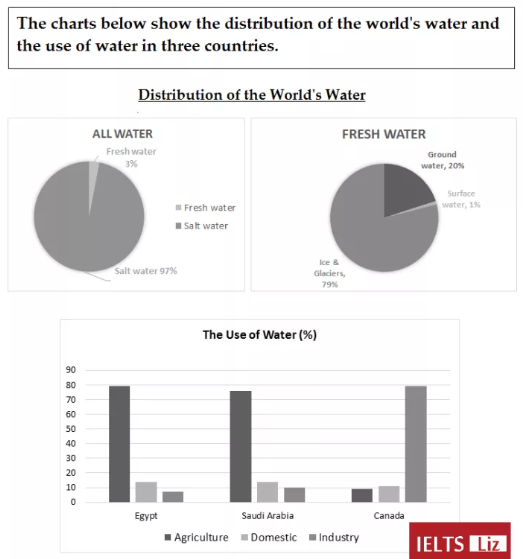
The pie chart given offers insight into statistic on water resources while the bar chart illustrate the quantity of water utilized in three distinct nations namely Egypt, Saudi Arabia, and Canada.
It is evident that salty water accounted for the bulk of water resources while freshwater was just minimal share, in which were groundwater, ice water, and easily accessible surface water.
As far as the pie chart is concerned, the amount of salty water was a remarkable number ith more or less 100% in all water. Besides, the figure for freshwater was 3% that including groundwater was one-fifth which over threefold lower compared to ice water. Lastly, one in ten belonged to the quantity of the remaining water resource.
As can be seen from the bar chart, the utilization of water in Egypt for agriculture was the highest with over a half (65%), followed by the figure for 'Domestic' and 'Industry', 25% and 10%, accordingly. The same scenario can be seen in the use of water in Saudi Arabia, in which the figure for agriculture ranked first with approximately 80%, 'domestic' was roughly a quarter that was 5% larger in comparison with 'industry'. The remaining country had the utilization for the industry was the largest portion which over doubled to that of 'domestic' and six times higher than the remaining sector.
Top answer
Please post essays in the essay forum so a moderator does not have to move your post. htm Please do not put the essay instructions in the "Subject" line. Put it with your answer in the message body.
- Please post essays in the essay forum so a moderator does not have to move your post.
- htm Please do not put the essay instructions in the "Subject" line.
- Put it with your answer in the message body.
- ) ---------------------
Get the Weekly English Kit 📬
New words, one handy idiom, and a 2-minute quiz — delivered to your inbox to keep your streak alive.
Please post essays in the essay forum so a moderator does not have to move your post.
https://www.englishforums.com/English/EssayReportCompositionWriting/Forum9.htm
Please do not put the essay instructions in the "Subject" line.
Put it
The pie chart (There is more than one. ) given offers insight into statistic (That is not clear. What exactly is on the pie chart?) on water resources while the bar chart illustrate (wrong word - shows, gives, presents, compares ) the
 Related Questions