
The pie chart
Two pie charts compare the percentage of different kinds of power that were manufactured in France between 1995 and 2005, a period of ten years.
It’s clear from two charts that the figure for Gas was the highest, this made up more than a quarter percent on the chart.
In 1995, Gas, Petro and Coal were similar for the figure, 29.63%, 29.27% and 29.8% respectively. Meanwhile, the proportion of Nuclear was lowest, it was less than Gas nearly 20 percent. The rest of segment was the other, was only 4,9 percent.
In 2005, generally, Gas and Coal all risen gradually in their figures, each other was over 30%. Whereas, a significant number of Petro showed that decreased sharply, 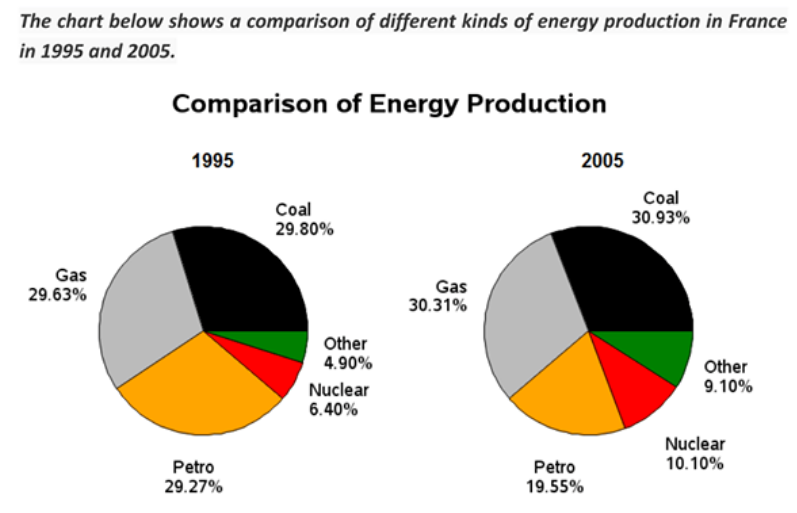
approximately to 19.55%. Nuclear production in France compared to less than nearly 5% from in 1995. The last, the rate of other increased modestly, at 9.10%.
Top answer
o Duong Nguyên power that were manufactured Electricity is generated . o Duong Nguyên Gas, Petro and Coal These should not have capital letters. The second word makes no sense.
- o Duong Nguyên power that were manufactured Electricity is generated .
- o Duong Nguyên Gas, Petro and Coal These should not have capital letters.
- The second word makes no sense.
- org/dictionary/english/petrol ?
Get the Weekly English Kit 📬
New words, one handy idiom, and a 2-minute quiz — delivered to your inbox to keep your streak alive.
Th?o Duong Nguyênpower that were manufactured
Electricity is generated.
Th?o Duong NguyênGas, Petro and Coal
These should not have capital letters. The second word makes no sense. Do you mean petrol
The two pie charts compare the percentages of different kinds types of fuel power that were manufactured used in the production of energy in France
 Related Questions