
The percentage of school aged boys in different age groups who parcitipated in 5 different sports in the UK in 2010.
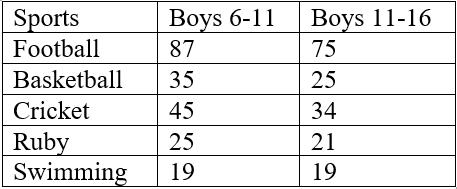
The given table compares the proportion of school boys in two groups of ages engaging in a variety of sports: football, basketball, cricket, rugby, and swimming in Britain in the year 2010.
The primary characteristic of the table is that boys who are younger had a tendency to play sports more than older ones. Football was the most significant figure in both age groups, while the opposite was true for swimming.
Regarding male youngsters, the figure for football took up 87%, followed by nearly a half in cricket, over a third in basketball, and a quarter in ruby. In addition, the percentage of attendants in swimming only accounted for a fifth in 2010.
In terms of players aged between 11 and 16, the ratio of football was at 75%. As the ranks went down, the figures for other sports declined, namely 34% in cricket, 25% in basketball, and 21% in ruby. Nevertheless, the proportion of swimmers in this age group remained stable, at 19%.
Top answer
The given table compares the proportion s of school boys in two age groups (6-11 and 11-16) of ages engaging who engaged in a variety one of five sports: football, basketball, cricket, rugby, and or swimming in Britain in the year 2010. [ 1 ] The primary characteristic of the table is that Overall, boys who are in the younger age group had a tendency to play sports more than the older ones. Moreover, f ootball was the most significant figure popular sport in both age groups, while the opposite was true for swimming.
- The given table compares the proportion s of school boys in two age groups (6-11 and 11-16) of ages engaging who engaged in a variety one of five sports: football, basketball, cricket, rugby, and or swimming in Britain in the year 2010.
- [ 1 ] The primary characteristic of the table is that Overall, boys who are in the younger age group had a tendency to play sports more than the older ones.
- Moreover, f ootball was the most significant figure popular sport in both age groups, while the opposite was true for swimming.
- Regarding male youngsters, For the younger group, the figure for football took up was very popular, as 87% reported playing that sport , followed by nearly a half in after which came cricket, with just under half participating in that, while over a third of the boys in that group in played basketball, and a quarter in played ruby.
- In addition, contrast, the percentage of attendants in for swimming was only accounted for a fifth 19% in 2010.
Get the Weekly English Kit 📬
New words, one handy idiom, and a 2-minute quiz — delivered to your inbox to keep your streak alive.
The given table compares the proportions of school boys in two age groups (6-11 and 11-16) of ages engaging who engaged in a variety one of
 Related Questions