
The online shopping sales for retail sectors in Canada in 2005 and 2010.
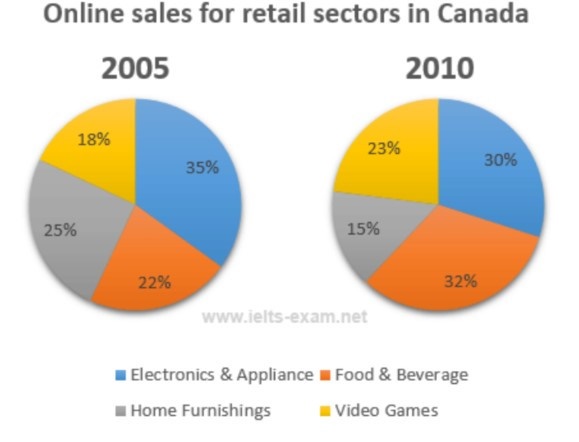
The given pie charts compare the online sales from 4 various retail sectors in Canada in 2005 and 2010.
It can be clearly seen from the graphs that the percentage of different sectors experienced certain changes in 5 years. While the electronics & appliance and home furnishings groups saw a downward trend in its’ sales, the reverse was true for the remained categories.
The sales from electronics & appliance occupied exactly 35% in 2005. After 5 years, this sector went down by 5% in its online shopping purchases. Similarly, the portion of online sales in home furnishings underwent a reduction of 10%, from 25% to 15% in 5 years.
Conversely, both food & beverage’s and video games’ online revenues went up noticeably. To be specific, the sales which customers made with the internet for video games was just under one fifth in total, at 18% in the first point of the survey while that of food & beverage accounted 22%. In 2010, the sales from which people made purchases for food and beverage portion rose up to 32% whereas the percentage of sales in video games grew by 10%.
Get the Weekly English Kit 📬
New words, one handy idiom, and a 2-minute quiz — delivered to your inbox to keep your streak alive.
 Related Questions