
The Line Graph - thanks for your help
The graph below shows electricity production (in terawatt hours) in France between 1980 and 2012
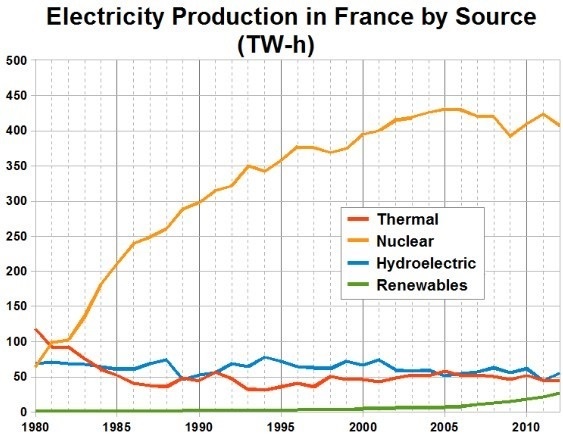
The line graph illustrates the amount of electricity produced by four different sources in France over a 32 year period.
It is clear from the graph that nuclear were by far the most important means of electricity generation. While renewables supplied the lowest amount of electricity produced.
In 1980, thermal is shown as the primary source of electricity which is approximately 110 terawatt hours of electricity. By contrast, the figures for nuclear and hydroelectric were both just over 60 terawatt hours. In the next year, nuclear overtook thermal and kept growing dramatically until reaching a peak in 2005.
The amount of electricity produced by thermal saw an slightly decline from over 110 to nearly 50 terawatt hours. Whereas the figure for hydroelectricity remained stable for the whole 32 year period. However, there was a smoothly rise of electricity production using renewable from 2005 to 2012.
Top answer
The line graph illustrates the amount of electricity produced by four different sources in France over a 32-year period. It is clear from the graph that N uclear (missing word) were by far the most important means of electricity generation. While renewables supplied the lowest amount of electricity produced.
- The line graph illustrates the amount of electricity produced by four different sources in France over a 32-year period.
- It is clear from the graph that N uclear (missing word) were by far the most important means of electricity generation.
- While renewables supplied the lowest amount of electricity produced.
- (fragment) In 1980, thermal (missing word) is shown as the primary source of electricity which is approximately 110 terawatt hours of electricity.
- By contrast, the figures for nuclear and hydroelectric were both just over 60 terawatt hours.
Get the Weekly English Kit 📬
New words, one handy idiom, and a 2-minute quiz — delivered to your inbox to keep your streak alive.
The line graph illustrates the amount of electricity produced by four different sources in France over a 32-year period.
It is clear from the graph that Nuclear (missing word) were by far the most important means of electricity generation. While renewables supplied the lowest amount of electricity produced.
 Related Questions