
The line graph below shows the changes in the share price of Outokumpu companies in euros between January 2006 and December 2010.
The line chart represents the changes in the stock of Outokumpu companies in euros in the period 2006 to 2010.
The stock was up and down in frame time. The price of the stock was highest in 2007 and was lowest in 2008.
In January 2006, the stock was started by 13 euros. It was rising to January 2007 by 31 EUR, that was the major peak of the time frame. During that time, the stock was rising from 31 EUR to 13 EUR. After January 2007 to December 2008, the line was up and down from 31 EUR to 8 EUR. 8 EURin December 2008 was the minor peak of the line chart. The last period of January 2009 to December 2010, the stock was recovered and continued to rise until it reached a peak of EUR 17 in December 2010. It was a litter bit rise compere January 2006.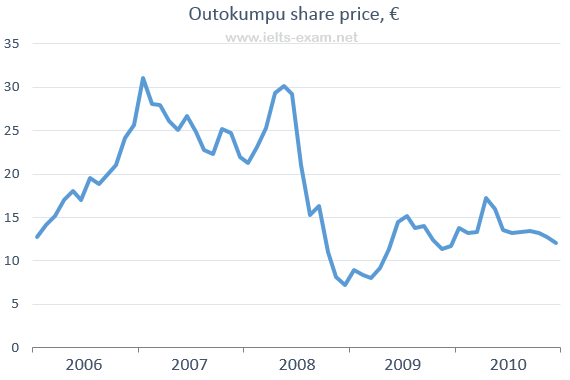
Top answer
Please do not put the essay instructions in the "Subject" line. Put it with your answer in the message body. Subject: Please review my IELTS essay Message body: Topic: The line graph below shows the changes in the share price of Outokumpu companies in euros between January 2006 and December 2010.
- Please do not put the essay instructions in the "Subject" line.
- Put it with your answer in the message body.
- Subject: Please review my IELTS essay Message body: Topic: The line graph below shows the changes in the share price of Outokumpu companies in euros between January 2006 and December 2010.
- Please give us all the instructions.
- ) ---------------------
Get the Weekly English Kit 📬
New words, one handy idiom, and a 2-minute quiz — delivered to your inbox to keep your streak alive.
Please do not put the essay instructions in the "Subject" line.
Put it with your answer in the message body.
Subject: Please review my IELTS essay
Message body:
Topic: The line graph below shows the changes in the share price of Outokumpu companies in euros between January 2006 and December 2010. Please give us all the instructions.
The line chart represents (wrong word) the changes in the stock (wrong expression) of Outokumpu companies in euros in the period 2006 to 2010.
The stock was up and down in frame time. (wrong expression) The price of the stock
 Related Questions