
The graph shows the percentage of UK adolescents following a vegetarian diet. Summarise the information by selecting and reporting the main features.
The line graph demonstrates the proportion of young British people who choose to eat a vegetarian diet from 1960 to 2020.
Overall, the picture shows two key domains of vegetarianism: one peaking around 1980 and the second in 2015 after approximately forty years.
In 1960, only a small percentage of adolescents ( about 1%) were vegetarian. There was a sharp increase within 20 years later to peak at around 15 % in 1980. 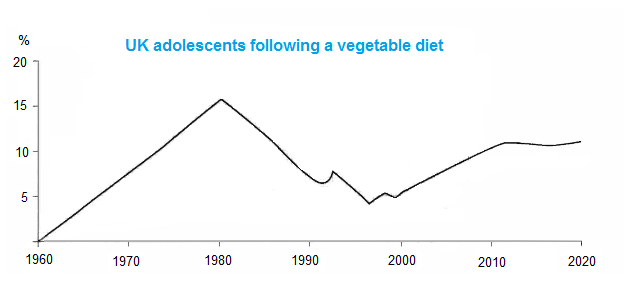
Thereafter, it dropped steeply over the next 10 years, followed by a slight fluctuation from nearly 7% in 1990 to 5% in 2000. During this period, the rate of young vegetarians reached the lowest point of just 4% in 1996. Since then, the number of young British people has gradually risen to peak at approximately 10% in 2015 and continuously remained the same between 9% in 2010 and 12 % in 2020.
Top answer
Please post essays in the essay forum. Click here: Please include all the essay instructions, but do not put them in the "Subject" line. Put it with your answer in the message body.
- Please post essays in the essay forum.
- Click here: Please include all the essay instructions, but do not put them in the "Subject" line.
- Put it with your answer in the message body.
- Subject: Please review my IELTS essay Message body: Topic: The graph shows the percentage of UK adolescents following a vegetarian diet.
- Summarise the information by selecting and reporting the main features.
Get the Weekly English Kit 📬
New words, one handy idiom, and a 2-minute quiz — delivered to your inbox to keep your streak alive.
Please post essays in the essay forum. Click here:
Please include all the essay instructions, but do not put them in the "Subject" line.
Put it with your answer in the message body.
Subject: Please review my IELTS essay
Message body:
Topic:
The graph shows the percentage of UK adolescents following a vegetarian diet. Summarise the information by selecting
The line graph demonstrates (wrong word) plots the proportion of young British people who chose choose to eat a vegetarian diet from 1960 to 2020.
Overall, the picture shows there are
 Related Questions