
The graph below shows the proportion ò the population aged 65 and over between 1940 and 2040 in three different countries
The line graph illustrates the distribution of the people aged 65 or older from 1940 to 2040 in three countries, namely Japan, Sweden and the USA.
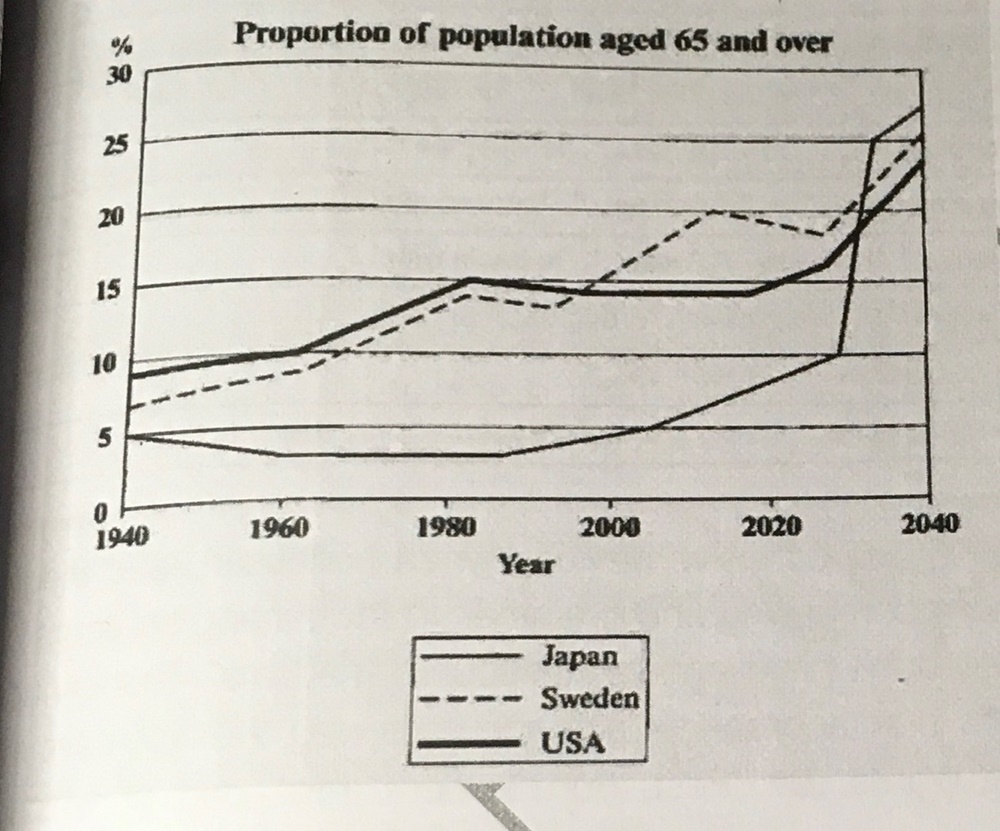
Overall, in 1940, the percentage of population aged 65 or over of the USA was the highest and Japan’s one was the lowest, but the prediction shows that there will be a switch position between the two countries in the end of the period, which Japan’s figure will come on top and the USA’s figure will be the smallest.
In 1940, around 9% of Americans were aged 65 or older, compared to around 7% of Swedish people and 5% of Japanese people. The proportion of elderly people in the USA and Sweden grew gradually over the next 50 years, reaching under 15% in 1990. By contrast, the figure for Japan remained below 5% until the early 2000s.
Looking into the future, it is predicted that there will be a sudden growth in the percentage of elderly people of Japan, with a jump over 15% from 2030 to 2040. By 2040, around 27% of Japanese people are expected to be 65 years old or older, while the figures for Sweden and the USA are slightly lower, about 25% and 23% respectively.
Top answer
The line graph illustrates the distribution percentage of the people aged 65 or older from 1940 to 2040 in three countrie s: namely Japan, Sweden and the USA. Overall, in 1940, the percentage [ 1] of population aged 65 or over of for the USA was the highest and Japan’s one was the lowest, but the prediction shows that there will be a it is predicted that those two will switch position between the two countries in near the end of the that period. , which Japan’s figure will come on top and the USA’s figure will be the smallest.
- The line graph illustrates the distribution percentage of the people aged 65 or older from 1940 to 2040 in three countrie s: namely Japan, Sweden and the USA.
- Overall, in 1940, the percentage [ 1] of population aged 65 or over of for the USA was the highest and Japan’s one was the lowest, but the prediction shows that there will be a it is predicted that those two will switch position between the two countries in near the end of the that period.
- , which Japan’s figure will come on top and the USA’s figure will be the smallest.
- In 1940, around 9% of Americans were aged 65 or older, compared to around 7% of Swedish people and 5% of Japanese people.
- The proportion of elderly people in graphs for the USA and Sweden grew gradually , and in tandem, over the [ 2] next subsequent 50 40 years, both reaching [ 3] under around 15% in by 1990 1980 .
Get the Weekly English Kit 📬
New words, one handy idiom, and a 2-minute quiz — delivered to your inbox to keep your streak alive.
The line graph illustrates the distribution percentage of the people aged 65 or older from 1940 to 2040 in three countries: namely Japan, Sweden and the USA.
Overall, in 1940, the percentage [ 1] of population aged 65 or over of
 Related Questions