
The graph below shows the percentage of people in the different age group who went to the cinema once a month in Great Britain.
The line graph illustrates the proportion of those in different generations who watched film in the movie theater monthly in Britain over a course of 16 years starting from 1984.
Generally, it is evident that the percentage of monthly guests to the cinema in thes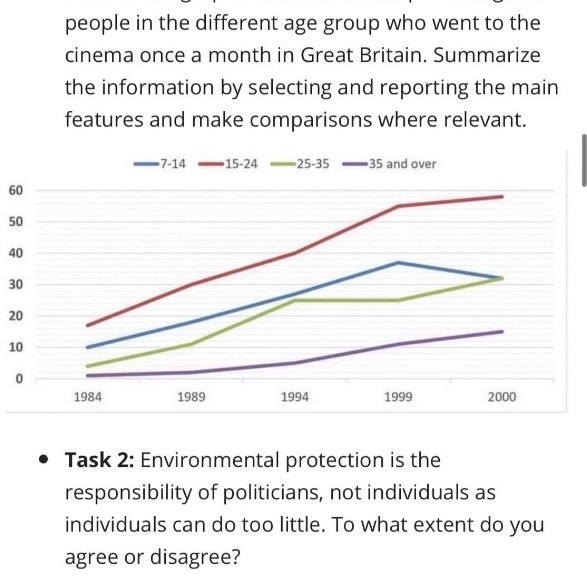
e age groups witnessed an upward trend over the time frame with the figure for teenagers being the highest number.
In 1984, the data for people who are 15-24 years old registered the highest among the four, standing at about 18%. This number rose exponentially to 56% in 1999 before suffering a marginal increase to approximately 58% in 2000. A similar trend can be seen in the rate for people who are over 35 years old, as it stood in just under 2% in the first year and then increased progressively to roughly 6% in 1994. After that, it registered a steady growth to 15% in 2000. Meanwhile, a sharp increase from 6% to 26% can be witnessed in the percentage of 25-35 years old individuals in 1994. It continued to gradually rise to 32% in 2000 although it suffered a slight decline from 1994 to 1999. By contrast, there was a plunge in the rate of children to 32% in 2000 after souring to approximately 38% in 1999 from 10% in the first year.
Get the Weekly English Kit 📬
New words, one handy idiom, and a 2-minute quiz — delivered to your inbox to keep your streak alive.
 Related Questions