
The graph below shows the number of visitors to three museums between 2000 and 2005. Summarize the information by selecting and reporting the main features, and make comparisons where relevant.
The graph inllustrates data about the number of tourists who visited to three museums between 2000 and 2005.
Overall, what stands out from the graph is that there were considerable upward trends in the number of National museum in China. While the number of MET museum in Newyork significant falls and increases in during the period. Another interesting point is that Edo museum in Tokyo was the most popular in 2000, but, in 2005, National museum in China was toured more than the others.
Looking in the details, the number of tourists National museum in China started at just 6 millions, after that there was a considerable rise during in the period at 16 millions in 2005. Besides, the number of tourists Met museum in Newyork began at 12 millions in 2000, after there was rapidly fall at 6 millions in 2001, but the number of tourists continute rise significant at 14 millions in 2005. And from 2000 to 2001, Edo museum in Tokyo used to the most poppular at 14 millions tourists, but after there was a coniderable drop at 6 millions in 2003 and after that there was incresase againat 10 millions in 2005.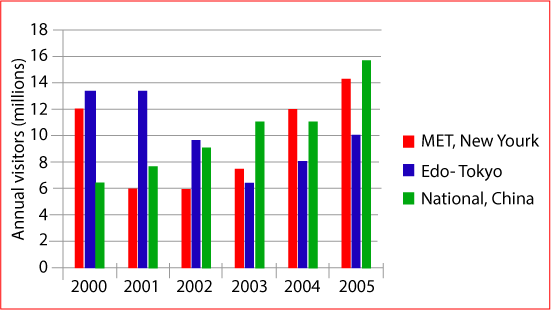
Top answer
I've bolded some parts that are a problem in some way. This is not a complete list, but you may wish to correct these and repost. Please ask about any that you do not understand.
- I've bolded some parts that are a problem in some way.
- This is not a complete list, but you may wish to correct these and repost.
- Please ask about any that you do not understand.
- The graph inllustrates data about the number of tourists visitors who visited to three museums between 2000 and 2005.
- Overall, what stands out from the graph is that there were considerable upward trends in the number of National museum in China .
Get the Weekly English Kit 📬
New words, one handy idiom, and a 2-minute quiz — delivered to your inbox to keep your streak alive.
I've bolded some parts that are a problem in some way. This is not a complete list, but you may wish to correct these and repost. Please ask about any that you do not understand.
The graph inllustrates data about the number of tourists visitors who visited to three museums between 2000 and 2005.
Overall, what stands out from
 Related Questions