
0
Vienvien0610 Posted 8 years ago
Essay & Composition Writing
The graph below shows the consumption of 3 spreads from 1981 to 2007.[ielts]
The given graph reveals the amount of spreads which were consumed over 26 years between 1981 and 2007.
Overall, the consumption of butter and margarine during the period given decreased slightly, while low fat & reduced spreads rose dramatically. In the first year, butter was the most common spreads used, then replaced by margarine from 1991 to 2001, following that low fat & reduced spreads became the widely used spread in the final year.
With regards to the consumption of butter, it went up sharply from 140 gram to 160 gram in the beginning then plunged to a low of just 60 gram in 2007. Likewise, the amount of margarine used fluctuated at somewhere between 80 and 100 gram prior to 2001, before dropping rapidly to 40 gram in 2007.
In other words, the consumption of low fat & reduced spreads grew from approximately 20 gram in 1996 and reached a peak of 80 gram in 2001. The following years, however, brought a sustained decline.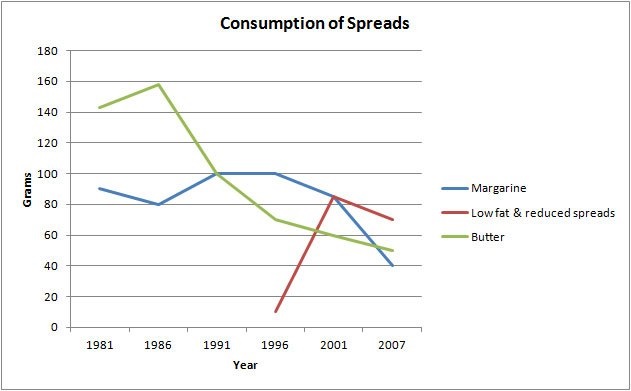
WRITE DESCRIPTION HERE
Top answer
The full instructions are missing. ) between 1981 and 2007. ) while low fat & reduced spreads rose dramatically.
- The full instructions are missing.
- ) between 1981 and 2007.
- ) while low fat & reduced spreads rose dramatically.
- In the first year, butter was the most common spreads used, then replaced by margarine from 1991 to 200 1, (comma splice error) following that low fat & reduced spreads became the (missing word) widely used spread in the final year.
- With regards to the consumption of butter, it went up sharply from 140 gram to 160 gram in the beginning (be specific) then plunged to a low of just 60 gram in 2007.
Get the Weekly English Kit 📬
New words, one handy idiom, and a 2-minute quiz — delivered to your inbox to keep your streak alive.
1 Answers
0
The full instructions are missing. It should be this:
The graph shows the daily consumption of three spreads per person from 1981 to 2007
The given graph reveals shows the amount of spreads which were consumed over 26 years (That is not what the graph actually shows.) between 1981 and 2007.
Overall, the consumptio
 Related Questions