
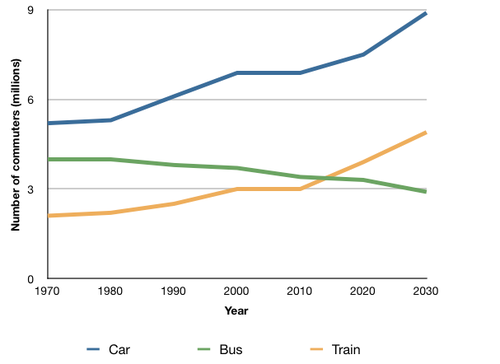
The graph below shows the average number of UK commuters travelling each day by car, bus, or train between 1970 and 2030.
The line graph compares figures for daily travel of workers in the UK using the three different forms of transport (car, bus and train) during over the 60 years from 1970 to 2030. Units are measured by millions.
Overall, the car is the most popular means of transport for UK commuters travel throughout the period shown. Meanwhile, a great number of people use car and train grow gradually, the number of bus users decrease steadily.
In 1970, approximately 5 million of UK commuters drove the car on a daily basis, while the bus and train were used by about 4 million and 2 million people respectively. In the year 2000, the number of car users rose dramatically to around 7 million people. Likewise, the number of commuting rail passengers increased gradually to 3 million people after remaining stable during the 10-year period. However, there was a slight drop of approximately 0.5 million people using the bus.
By 2030, it is predicted the number of people driving the car to work will reach almost 9 million, and the train users also rise. By contrast, buses are predicted to become the less popular choice, with only under 3 million daily users.
Top answer
The line graph compares three different modes of transport (car, bus and train) in the UK in terms of the number of daily commuters which used them over a 60-year period starting in 1970. figures for daily travel of workers in the UK using the three different forms of transport (car, bus and train) during over the 60 years from 1970 to 2030. Units are measured by millions.
- The line graph compares three different modes of transport (car, bus and train) in the UK in terms of the number of daily commuters which used them over a 60-year period starting in 1970.
- figures for daily travel of workers in the UK using the three different forms of transport (car, bus and train) during over the 60 years from 1970 to 2030.
- Units are measured by millions.
- Overall, the car is the most popular means of transport for UK commuters travel throughout the period in question.
- shown.
Get the Weekly English Kit 📬
New words, one handy idiom, and a 2-minute quiz — delivered to your inbox to keep your streak alive.
The line graph compares three different modes of transport (car, bus and train) in the UK in terms of the number of daily commuters which used them over a 60-year period starting in 1970. figures for daily travel of workers in the UK using the three different forms of transport (car, bus and train) durin
Please post essays here:
https://www.englishforums.com/English/EssayReportCompositionWriting/Forum9.htm
Please do not put the essay instructions in the "Subject" line.
Put it with your answer in the message body.
Subject: Please rev
The relevant line chart furnishing a survey report on “How Britishers varying thier preferences amongst shuttle options between Public transport and own vehicle? ” And the whole data served in numbers in Millions, Since 1970 to 2030.
This line chart clearly reveals that, Car seems popular choice amongst them and tends to remain top as 5 Millions during 1970 and with continuous growth of
 Related Questions