
The graph below shows how elderly people in Europe spent their free time between 1980 and 2010 Summarize the information by selecting and reporting the main features, and make comparisons where relevant.
The line graph gives information about kinds of free time activities that elderly people in Europe do from 1980s to 2010s. Overall, the rate of hiking increased significantly. On the other hand, playing sport remained stablest compared to others.
In the period between 1980s and 1990s, all activities increased considerably, only theatre dropped sharply, from 50% in 1980s to 30% in 1990s. Among five activities, playing sport is the most common one with the rate of more 60%. Mean while, surfing the Internet is the lowest with only around under 10% of the graph.
Over the 20-year period, the rate of all five activities changed dramatically. In 2010s, the rate of hiking reached the highest point, at 80% and became the most popular activity, At the same time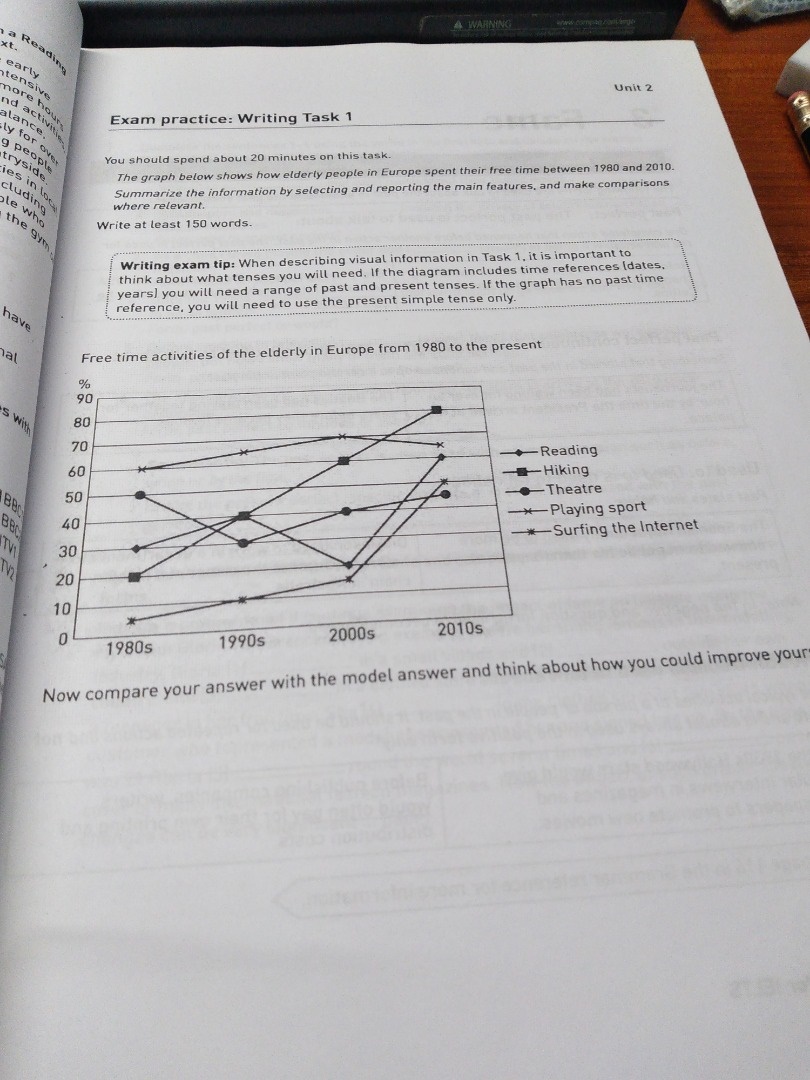
, surfing the Internet also had an impressive increasing, from only 10% in 1990s to 50% in 2010s. Additionally, the fluctuation of reading can be noticed when it reached the lowest point, at 20% in 2000s but grew immediately in the next 10 years with the rate of 60%. Even though the percentage of playing sport decreased in 2010s but not remarkable and theatre was thought to be the most stable among five activities.
Top answer
The line graph gives information about (Vague. ) kinds of free time activities that elderly people in Europe do (wrong tense. ) from 1980s to 2010s.
- The line graph gives information about (Vague.
- ) kinds of free time activities that elderly people in Europe do (wrong tense.
- ) from 1980s to 2010s.
- (You violated a rule of paragraphing here.
- A paragraph has one main topic.
Get the Weekly English Kit 📬
New words, one handy idiom, and a 2-minute quiz — delivered to your inbox to keep your streak alive.
The line graph gives information about (Vague. You should tell the reader exactly what is plotted on the graph.) kinds of free time activities that elderly people in Europe do (wrong tense. This information is in the past.) from 1980s to 2010s. (You violated a rule of paragraphing her
Sample essay.
Paragraph #1: Describe the figure so that the reader can picture it in their mind.
The line graph plots the percentage of elderly people in Europe who participated in each of five different activities (reading, hiking, theatre, playing sport and surfing the internet) between 1980 and 2010. There is one data point for each activity given for each decade.
 Related Questions