
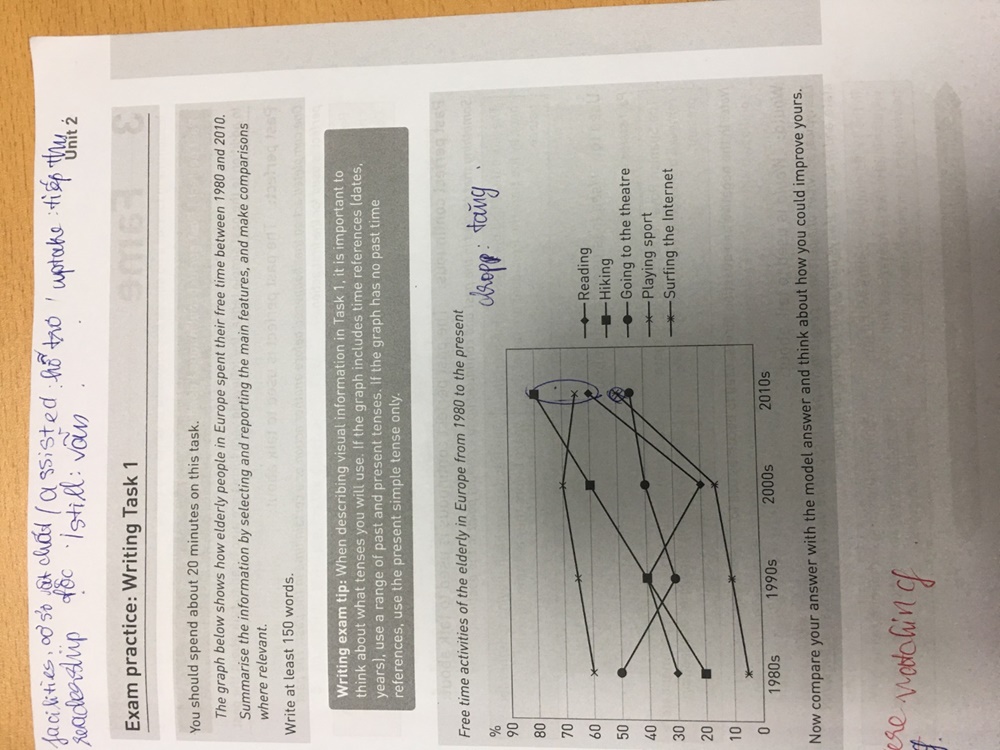
The Graph Below Show How Elderly People In Europe Spent Their Free Time Between 1980 And 2010.
The graph indicated some activities the elderly in Europe do in their free time in the period 30 years since 1980.
Most activities are different fluctuation, there had been rising for 30 years except they don’t like to go to the theatre. Reading was an old-fashioned activity, that was gone up from 30% to 40%, before the period from 1990 to 2000, it has gone down 20% but was climbed 40% from 2000 to 2010. There was a dramatic rise in all activities from 20% to 80% between 1980 and 2010. Going to the theatre was dropped by 5% from 1980 to 2010, there was dropped by 30% in 1990 and rose by 45% in 2010. The period from 1980 to 2010 experienced a slight increase in playing sport, there was rose from 60% to 65%. The last activity is surfing the internet, it was slightly grown from 1980 to 2000, but there was a steep boom of 35% in the period between 2000 and 2010.
Overall, during 20 years early, the elderly had wanted going out. But after 10 years, a fraction of the elderly had used the internet as the way to relax.
Top answer
You posted this essay a few days ago. See my comments in the previous thread.
- You posted this essay a few days ago.
- See my comments in the previous thread.
Get the Weekly English Kit 📬
New words, one handy idiom, and a 2-minute quiz — delivered to your inbox to keep your streak alive.
You posted this essay a few days ago. See my comments in the previous thread.
 Related Questions