
The following bar chart shows the different modes of transport used to travel to and from work in one European city in 1960, 1980 and 2000.
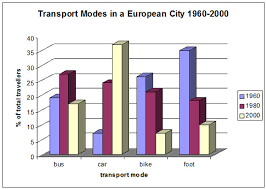
The bar chart illustrates information about the percentages of 4 means of transport (bus, car, bike and foot) used to travel to and from work in an European city between 1960 and 2000.
Overall, there were significant differences in preferences of 4 means during the search period. Additionally while the proportion of people used car increased dramatcally, the other 3 figures experienced decreases.
In the 1960, travelling by foot was by far the most favourite transport mode, accounting for over 35% of total travellers, compared with only 5% of people travelling by car. The figures for bus and bike were around 17% and 24% respectively.
The period between 1960 and 2000 witnessed a substancial increase in car users, growing to around 25% before reaching its peak of above 35% in 2000. In contrast, there were only nearly 10% of people walking to work and around 5% of people who used bike in 2000. The percent age of bus travellers was approxoately 25% in 1980 before falling to 15% in 2000.
Top answer
The bar chart illustrates compares information about the percentages of 4 means of transport (bus, car, bike and foot) used to travel to and from work in an European city at three time points between 1960 and 2000. Overall, there were significant differences in preferences of the 4 means during the search period. ) Additionally (missing punctuation) while the proportion of people used car ("Used car does not work here.
- The bar chart illustrates compares information about the percentages of 4 means of transport (bus, car, bike and foot) used to travel to and from work in an European city at three time points between 1960 and 2000.
- Overall, there were significant differences in preferences of the 4 means during the search period.
- ) Additionally (missing punctuation) while the proportion of people used car ("Used car does not work here.
- ) figures experienced decreases.
- In the 1960, travelling by foot was by far the most favourite transport mode, accounting for over 35% of total travellers, compared with only 5% of people travelling by car.
Get the Weekly English Kit 📬
New words, one handy idiom, and a 2-minute quiz — delivered to your inbox to keep your streak alive.
The bar chart illustrates compares information about the percentages of 4 means of transport (bus, car, bike and foot) used to travel to and from work in an European city at three time points between 1960 and 2000.
Overall, there were significant differences in preferences of the 4 means during the
 Related Questions