
The first chart below gives information about the money spent by British parents on their children’s sports between 2008 and 2014. The second chart shows the number of children who participated in three sports in Britain over the same time period.
The line graphs illustrate that British parents waste their money on their children’s sporting activities and the participation of British children in three different sports from 2008 to 2014.
It can be seen clearly from the chart that the average monthly money which British parents spend on the children’s sports increased steadily, meanwhile the number of children who took part in football, athletics, and swimming rose.
In 2008, parents in British paid 20 pounds for their children to participate in sporting activities. There was a dramatic growth in the amount of money which the parents spent on their children’s sports in British over the period of four years, approximately 31 pounds.
The number of children taking part in football and athletics remained stable, while there was a slight increase in the attendance of children in swimming, about nearly 7,5 millions, 0,5 millions and 2,4 millions respectively between 2008 and 2010. In the next four years, the participation of children in football and swimming grew moderately, around 9 millions and 4 millions. Besides, the number of children attending athletics climbed significantly, approximately 5 millions, and was as high as swimming from 2010 to 2012. 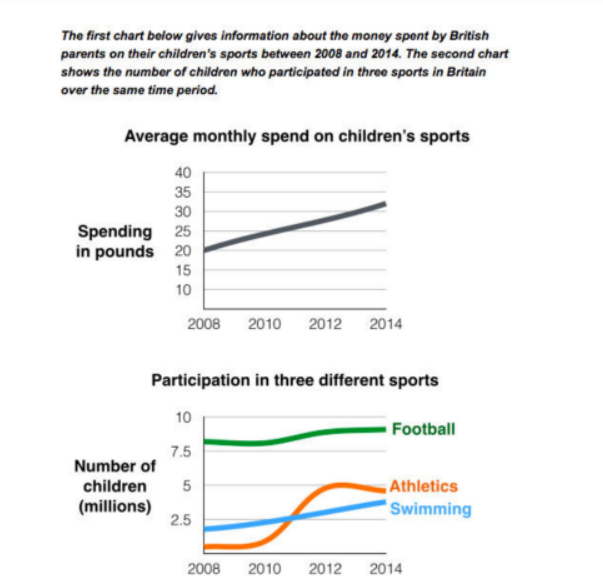
Top answer
The two line graphs illustrate that British [ 1] parent s’ spending [ 2] waste their money on their children’s sporting activitie s, and the participation of British children (in millions) in three different sports from 2008 to 2014. [ 3] It can be seen clearly from the chart that Overall, t he average monthly money amount which British parents spend [ 4 ] spent on the children’s sports increased steadily, meanwhile the number of children who took part in football, athletics, and swimming rose. In 2008, parents in British Britain paid 20 pounds for their children to participate in sporting activities.
- The two line graphs illustrate that British [ 1] parent s’ spending [ 2] waste their money on their children’s sporting activitie s, and the participation of British children (in millions) in three different sports from 2008 to 2014.
- [ 3] It can be seen clearly from the chart that Overall, t he average monthly money amount which British parents spend [ 4 ] spent on the children’s sports increased steadily, meanwhile the number of children who took part in football, athletics, and swimming rose.
- In 2008, parents in British Britain paid 20 pounds for their children to participate in sporting activities.
- Then, t here was a [ 5 ] dramatic steady growth in the amount of money which the parents spent on their children’s sports in British that spending over the period of following four years, to approximately 31 pounds.
- The number of children taking part in football and athletics remained stable, while there was a slight increase in the attendance of children in swimming, about nearly 7,5 millions, 0,5 millions and 2,4 millions respectively between 2008 and 2010.
Get the Weekly English Kit 📬
New words, one handy idiom, and a 2-minute quiz — delivered to your inbox to keep your streak alive.
The two line graphs illustrate that British [ 1] parents’ spending [ 2] waste their money on their children’s sporting activities, and the participation of British children
The two line graphs illustrate British parents’ spending money on their children’s sporting activities, and the participation of British children in football, athletics, and swimming from 2008 to 2014.
Overall, the average monthly amount which parents in Britain spent on their children increased steadily, meanwhile the number of children taking part in three different sports rose.
 Related Questions