
The charts below show what UK graduate and postgraduate students who did not go into full-time work did after leaving college in 2008 Summarise the information by selecting and reporting the main features, and make comparisons where relevant.
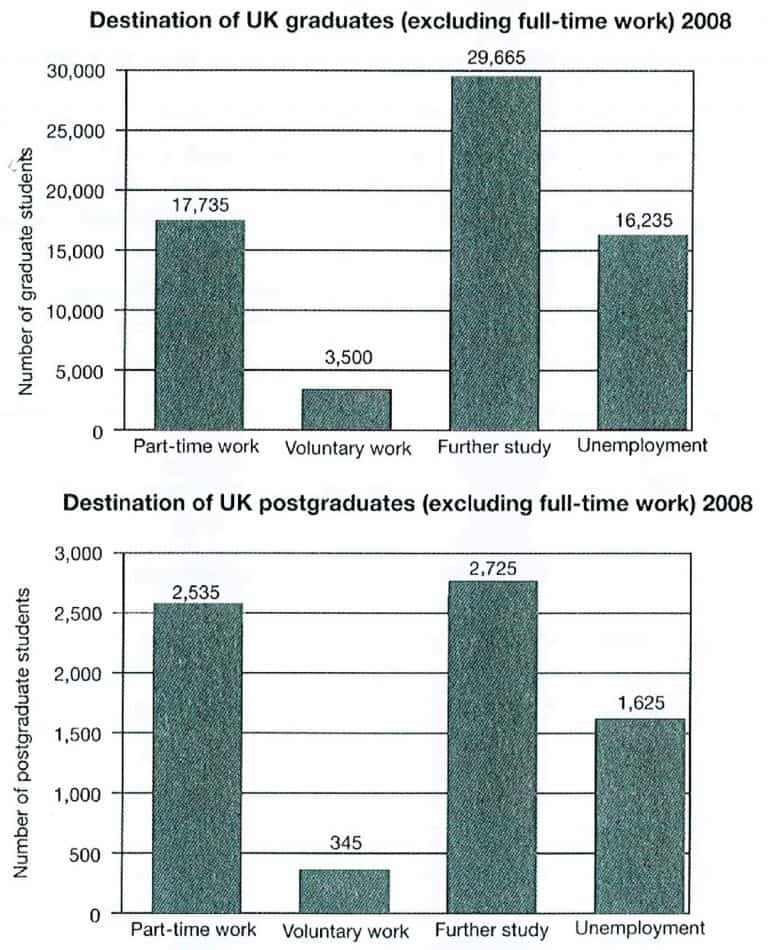
The charts illustrate the number of graduate and post-graduate students after completing their course in a college excluding full-time work in the UK in the year 2008.
Overall, both the graduate and post-graduate scholars had a maximum number of students attending further study, and the least number of students were engaged in voluntary work. Also, the count of graduates was too large compared to post-graduates.
According to the first bar chart, approximately 30,000 graduate students were planning for further study in 2008. Where the number of part-time workers and unemployed were likely to be the same, they were just above 15,000. A tiny number of people (3500) were active in voluntary work.
Again, from the second chart, like graduates, a significant number of postgraduate scholars were doing further study, which is nearly ten times less than graduates. In contrast, the part-time worker accounted for 2535 people, which was the second choice for the students. In addition, 1625 of them were unemployed that year, the count for a volunteer was below 500.
Get the Weekly English Kit 📬
New words, one handy idiom, and a 2-minute quiz — delivered to your inbox to keep your streak alive.
 Related Questions