
The charts below show the results of a questionnaire that asked visitors to the Parkway Hotel how they rated the hotel's customer service. The same questionnaire was given to 100 guests in the years 2005 and 2010. Summarise the information by...
The pie charts illustrate the finding of a questionaire about customer satisfication with Parkway Hotel's service in 2005 and 2010.
Overall, there was a significant increase in positive feedback for customer service. These figures demonstrated greatly progress in service improvement as a result of negative feedback.
In 2015, with almost half the pie chart dedicated to the satisfactory rating (45%), the Parkway Hotel performed poorly in their customer care, while excellent accounted for only 5%, far less than very poor(15%) and poor(21%).There was still negative reviews about hotel service. It is easy to see that in 2005, there were many customers who had experienced poor service.
Nevertheless, positive feedback rised noticeablely in 2010. The tables turned as approximately 40% in good rating. And it is obvious that excellent has been improved dramatically, reaching 28%. The negative rating from visitor saw a decline as their values decreased by 1-3% after five years.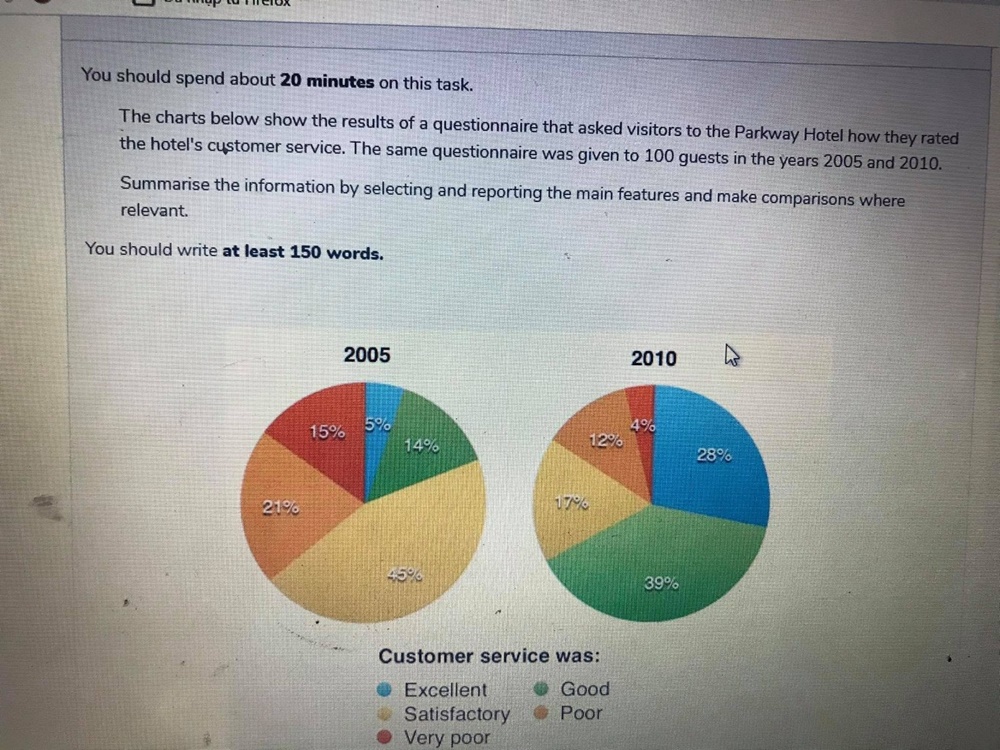
Top answer
Please post essays, paragraphs, dialogues and other writing in the essay forum so a moderator does not have to move your post. htm Please do not put the essay instructions in the "Subject" line. Put it with your answer in the message body.
- Please post essays, paragraphs, dialogues and other writing in the essay forum so a moderator does not have to move your post.
- htm Please do not put the essay instructions in the "Subject" line.
- Put it with your answer in the message body.
- Subject: Please review my IELTS essay Message body: Topic: Copy the essay instructions accurately here.
- ) --------------------- For Task 1: Read my advice for Task 1 essays.
Get the Weekly English Kit 📬
New words, one handy idiom, and a 2-minute quiz — delivered to your inbox to keep your streak alive.
Please post essays, paragraphs, dialogues and other writing in the essay forum so a moderator does not have to move your post.
https://www.englishforums.com/English/EssayReportCompositionWriting/Forum9.htm
Please do not put the essay i
The (How many?) pie charts illustrate (wrong word) the finding (wrong form) of a questionaire (spelling) about customer satisfication (spelling) with Parkway Hotel's ser
 Related Questions