
The chart below shows the results of a survey about people’s coffee and tea buying and drinking habits in five Australian cities. Summarize the information by selecting and reporting the main features, and make comparisons where relevant.
The chart below shows the results of a survey about people’s coffee and tea buying and drinking habits in five Australian cities.
Summarize the information by selecting and reporting the main features, and make comparisons where relevant.
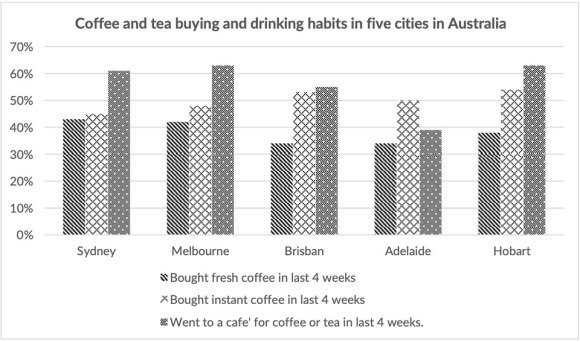
The diagram illustrates the habit of drinking and consuming coffee and tea of people in five different metropolises in Australia.
In general, the number of people who bought fresh coffee was lowest in total. Nearly all people had a tendency of going to a cafe to drink tea or coffee. In contrast, it was an exception in Adelaide, residents here were keen on buying instant coffee.
These were three cities which had the proportion of people who went to cafes for coffee or tea above 60%, they were Sydney, Melbourne, and Hobart(61%, 63% and 63%, respectively). While, the percentage of habitants who bought fresh coffee was lowest in Brisbane and Adelaide, it were 33% and 34%, respectively.
In Adelaide, the percentage of people who went to cafes for coffee or tea was higher than other habits, it was approximately 50%. The habits of going to a cafe for coffee or tea accounts for under 40%.
Top answer
Please put the essay instructions with your answer in the message body. Subject: Please review my IELTS essay Message body: Topic: Put the essay instructions here. --------------------- Please read my advice for Task 1 essays: IELTS TASK 1: Hints, Tips And Advice Vocabulary Words For Task 1: Reference Post
- Please put the essay instructions with your answer in the message body.
- Subject: Please review my IELTS essay Message body: Topic: Put the essay instructions here.
- --------------------- Please read my advice for Task 1 essays: IELTS TASK 1: Hints, Tips And Advice Vocabulary Words For Task 1: Reference Post
Get the Weekly English Kit 📬
New words, one handy idiom, and a 2-minute quiz — delivered to your inbox to keep your streak alive.
Please put the essay instructions with your answer in the message body.
Subject: Please review my IELTS essay
Message body:
Topic: Put the essay instructions here.
---------------------
Please read my advice for Task 1 essays:
The diagram (not a good word choice. Be very precise in Task 1) illustrates (not a good word choice. Read my advice.) the habit (One habit?) of drinking and consuming coffee and tea of people in
This type of Task 1 is a "Survey results" task. There is a survey of people asking them some questions. The results of the survey are given in pie charts or bar graphs.
You need a special approach to this kind of task. It is quite different from other task 1 essay types.
This sample essay will give you the skills to write a "survey" or "questionnaire" essay.
Outline:
Pa
 Related Questions