
The chart below shows the results of a survey about people’s coffee and tea buying and drinking habits in five Australian cities. Summarise the information by selecting and reporting the main features, and make comparisons where relevant.
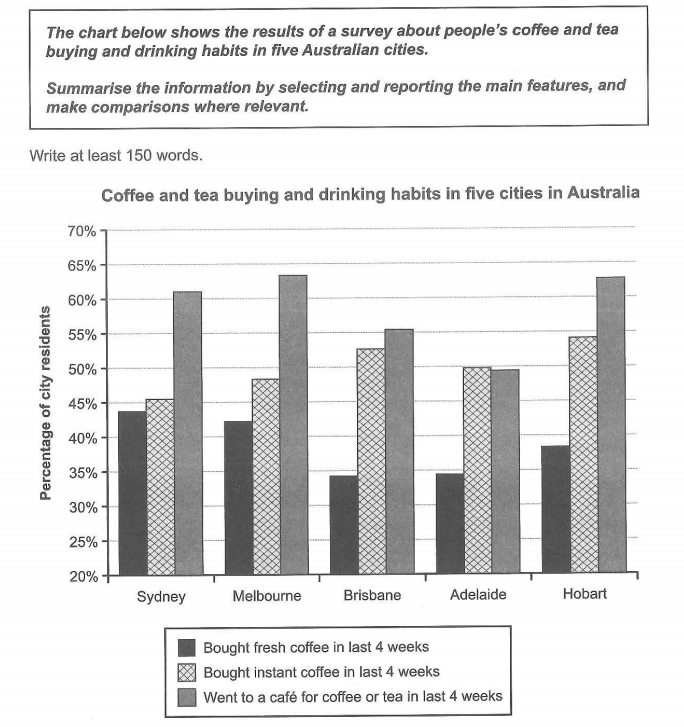
The chart below shows the percentage of three types of coffee that people
buy and drink recorded in 5 Australian cities in the last 4 weeks. It is
evident that in all the cities apart from Adelaide, most people went to a café
for coffee or tea and then bought instant or fresh coffee.
Looking at the chart, Sydney had the highest proportion of people who
bought fresh coffee, at 43% while just nearly 35% of people chose to buy
this kind of coffee in Brisbane. In terms of coffee in a café, the proportion of
people in Melbourne choosing it was dominant compared toin other cities,
at 63%. In contrast, going to café was less popular in Adelaide, at just with
about 50% percentage.
Hobart had nearly 55% of people drinking instant coffee, which was the
highest percentage, whereas, people drinking this coffee in Sydney were
just 45%. Meanwhile, Sydney, Melbourne, and Hobart had huge
differences in the figure for people who drank instant coffee and went to
café, while which in Adelaide had the approximately same proportion, at
50% (compared to 49% of people who went to café)
Top answer
Please do not put the essay instructions in the "Subject" line. Put it with your answer in the message body. Subject: Please review my IELTS essay Message body: Topic: Copy the essay instructions accurately here.
- Please do not put the essay instructions in the "Subject" line.
- Put it with your answer in the message body.
- Subject: Please review my IELTS essay Message body: Topic: Copy the essay instructions accurately here.
- ) ---------------------
Get the Weekly English Kit 📬
New words, one handy idiom, and a 2-minute quiz — delivered to your inbox to keep your streak alive.
Please do not put the essay instructions in the "Subject" line.
Put it with your answer in the message body.
Subject: Please review my IELTS essay
Message body:
Topic: Copy the essay instructions accurately here.
My essay:
(Your text here...)
---------------------
The (What kind of chart? There are pie charts, organization charts, Gantt charts and other types of charts. Be specific.) chart below shows the percentage of three types of coffee (That is not correct reporting. The chart does not have any "percentage of coffee". That makes no sense.) that people
buy and drink recorded in 5 (Do not use digits for small numbers that are not data values.)
 Related Questions