
The chart below shows the percentage of male and female teachers in six different types of educational setting in the UK in 2010
The bar chart indicates the male and female teachers’ ratio in six distinct types of educational establishments in the UK in 2010. The units are measured in percents.
Overall, it is clear that women teachers were greater in number than the men teachers in under-college levels of education, while more men teachers were employed in upper-college levels of education. In addition to this, the percentage who taught in college was similar.
According to the given chart, the fact that women achieve a dominance over men in nursery/pre and primary schools. There were over 95% and almost 95% female teachers in two levels respectively. Approximately 53% of women taught in secondary school – a ratio which was slightly higher than men. In college level, equal proportions of teachers from both genders were witnessed (about 50%) in 2010, in the UK.
In contrast, men get a higher percentage of teachers in the private training institute and university. There were almost 6% and 40% more male teachers than the women teachers in two levels respectively.
Please, help me review and grade this task. Thank you so much!??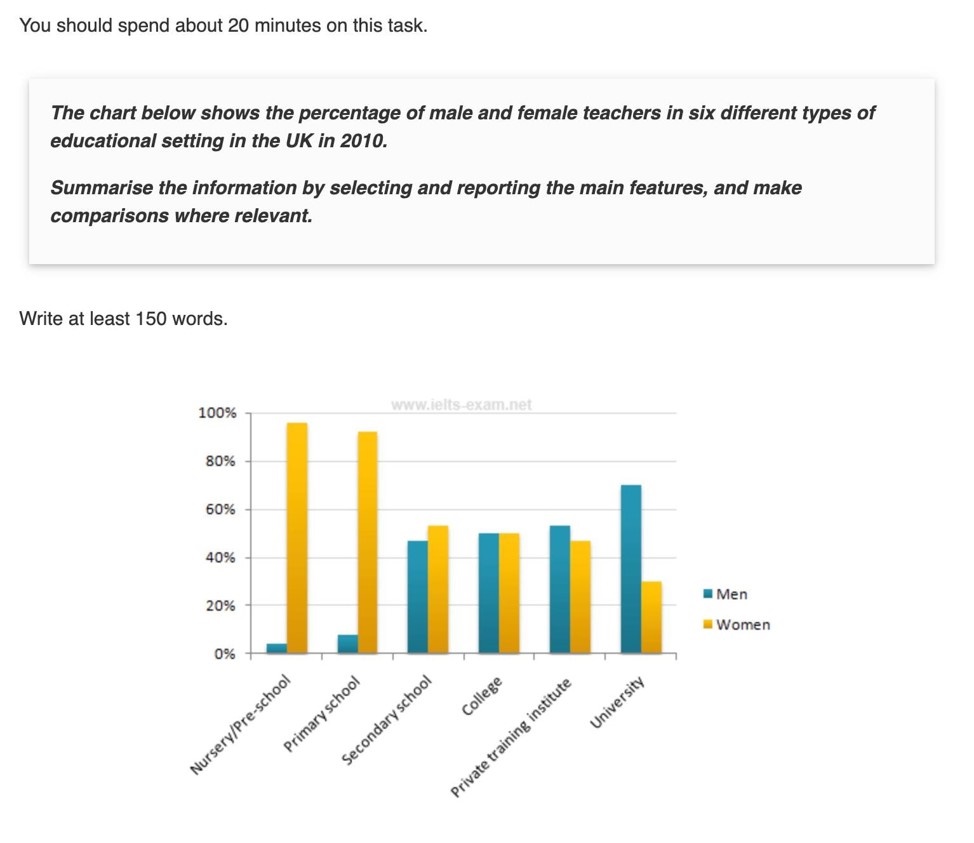
Top answer
The bar chart plots / gives indicates the male and female teachers’ rati o ratio of men to women in the faculty of in six distinct types of educational establishments in the UK in 2010. The units are measured in percent s. ) Overall, it is clear that (Unnecessary verbiage.
- The bar chart plots / gives indicates the male and female teachers’ rati o ratio of men to women in the faculty of in six distinct types of educational establishments in the UK in 2010.
- The units are measured in percent s.
- ) Overall, it is clear that (Unnecessary verbiage.
- Delete) women teachers were greater in number than the men teachers in lower under-college levels of education, while more men teachers were employed in upper-college high levels of education.
- In addition to this, the percentage s who taught in college was were equal .
Get the Weekly English Kit 📬
New words, one handy idiom, and a 2-minute quiz — delivered to your inbox to keep your streak alive.
The bar chart plots / gives indicates the male and female teachers’ ratio ratio of men to women in the faculty of in six distinct types of educational establishments in the UK in 2010.
Sample essay (175 words)
The bar chart compares the relative numbers of men and women teachers for six different types or levels of schooling in the UK in 2010. They cover the complete range from nursery school to university.
Overall, women predominate in three of the six levels, nursery, primary and secondary school, whereas men represent a higher percentage of th
 Related Questions